The bar graph given below shows the amount (in’000) of tax paid by three…
2022
The bar graph given below shows the amount (in’000) of tax paid by three different people. Read the data carefully and answer the questions.
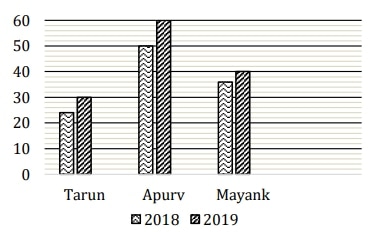
Find the ratio of total tax paid by Tarun and Mayank in 2018 to total tax paid by Apurv in 2018?
Answer: C. 6 : 5 — ConceptA ratio compares two quantities of the same kind by division. To compare a combined quantity with a single quantity, first read each value from the…
- A.
6 : 7
- B.
5 : 4
- C.
6 : 5
- D.
3 : 4
- E.
5 : 8
Attempted by 82 students.
Show answer & explanation
Correct answer: C
Concept
A ratio compares two quantities of the same kind by division. To compare a combined quantity with a single quantity, first read each value from the relevant category of the bar graph (here, the bars for the year 2018), add the values that belong together to form the numerator, take the single value as the denominator, then divide both terms by their greatest common factor to express the ratio in lowest terms.
Application
Reading the 2018 bars (the lighter, dotted bar in each group):
Person | Tax in 2018 (in ’000) |
|---|---|
Tarun | 25 |
Mayank | 35 |
Apurv | 50 |
Numerator — combined 2018 tax of Tarun and Mayank: 25 + 35 = 60.
Denominator — Apurv’s 2018 tax: 50.
Form the ratio: 60 : 50.
Divide both terms by their greatest common factor 10: 60 ÷ 10 = 6 and 50 ÷ 10 = 5, giving 6 : 5.
Cross-check
6 : 5 means the combined amount is 1.2 times the single amount; indeed 60 ÷ 50 = 1.2, and 6 ÷ 5 = 1.2 as well, so the simplified ratio preserves the original relationship. Only the 2018 bars were used — the 2019 bars (30, 40, 60) are not part of this question.