Directions : first bar graph shows total sales amount of three different…
2019
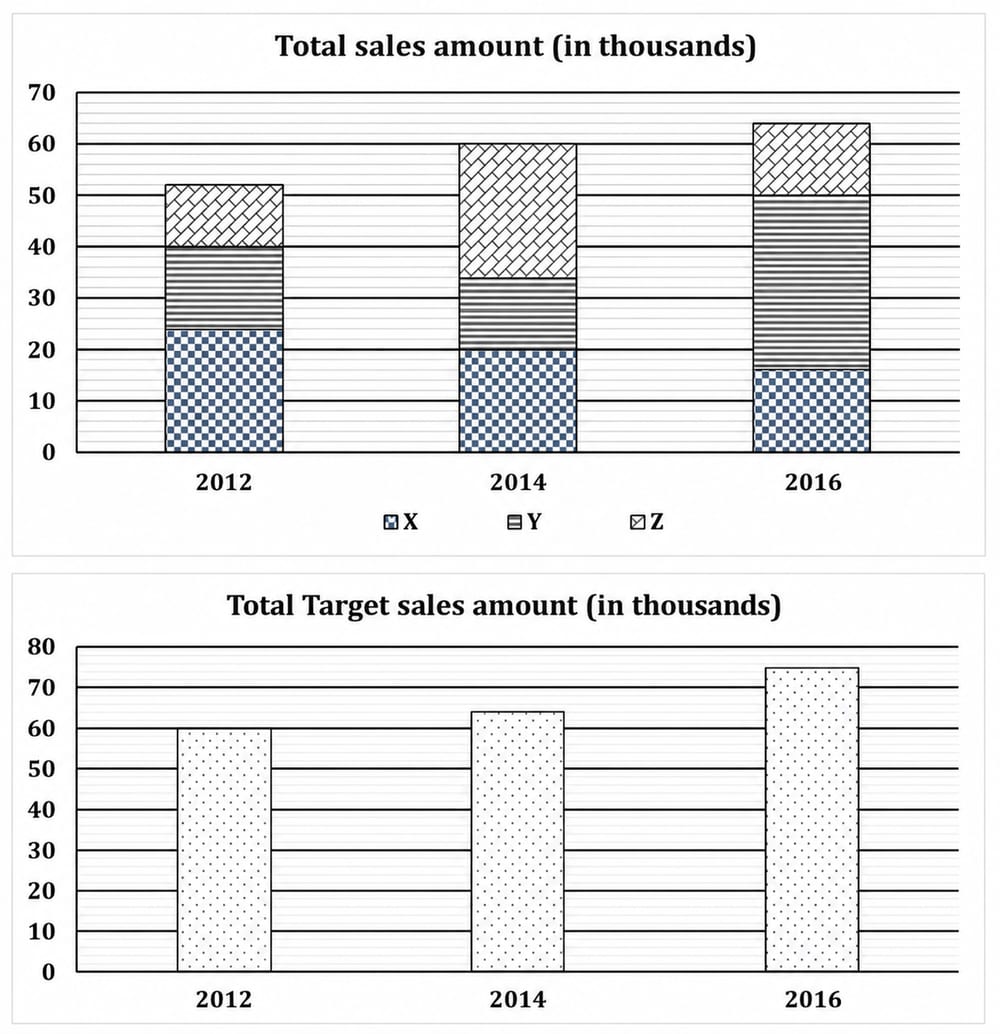
Directions : first bar graph shows total sales amount of three different companies in three different years and second bar graph shows the combined target sales amount of these 3 companies in these 3 years.
Total sales amount of X in 2012, 2014 and 2016 together is how much more/less than the total sales amount of Z in the same years?(in Rs.)
Answer: E. 8000 — ConceptIn a stacked bar graph each bar is built from segments placed one above the other, so a single company's value for a year is the HEIGHT OF ITS OWN…
- A.
11000
- B.
9000
- C.
7000
- D.
10000
- E.
8000
Attempted by 10 students.
Show answer & explanation
Correct answer: E
Concept
In a stacked bar graph each bar is built from segments placed one above the other, so a single company's value for a year is the HEIGHT OF ITS OWN SEGMENT, not the gridline its top reaches. The bottom segment is read from 0 to its top edge; every segment above it equals (its top edge) minus (the top edge of the segment just below it). To compare two companies across several years, find each company's segment value year by year, add them up separately, and subtract.
Application
All amounts are in thousands. X is the bottom segment of each bar; Z is the top segment, so Z = (whole-bar top) - (top edge of Y).
Read company X (bottom segment):
2012: X rises from 0 to 24, so X = 24.
2014: X rises from 0 to 20, so X = 20.
2016: X rises from 0 to 16, so X = 16.
Total X = 24 + 20 + 16 = 60 (thousand).
Read company Z (top segment = whole-bar top minus Y's top edge):
2012: bar top = 52, Y top edge = 40, so Z = 52 - 40 = 12.
2014: bar top = 60, Y top edge = 34, so Z = 60 - 34 = 26.
2016: bar top = 64, Y top edge = 50, so Z = 64 - 50 = 14.
Total Z = 12 + 26 + 14 = 52 (thousand).
Difference = Total X - Total Z = 60 - 52 = 8 thousand. Converting thousands to rupees: 8 x 1000 = Rs. 8000. Since X exceeds Z, X is Rs. 8000 MORE than Z.
Cross-check
Add a different way: X total 60 vs Z total 52 differ by 8 (thousand). Year-by-year the X-minus-Z gaps are (24-12)=12, (20-26)=-6, (16-14)=2; these sum to 12 - 6 + 2 = 8 (thousand) = Rs. 8000, matching the totals method. The target-sales bar graph is not needed for this question.