Directions : first bar graph shows total sales amount of three different…
2019
Directions : first bar graph shows total sales amount of three different companies in three different years and second bar graph shows the combined target sales amount of these 3 companies in these 3 years.
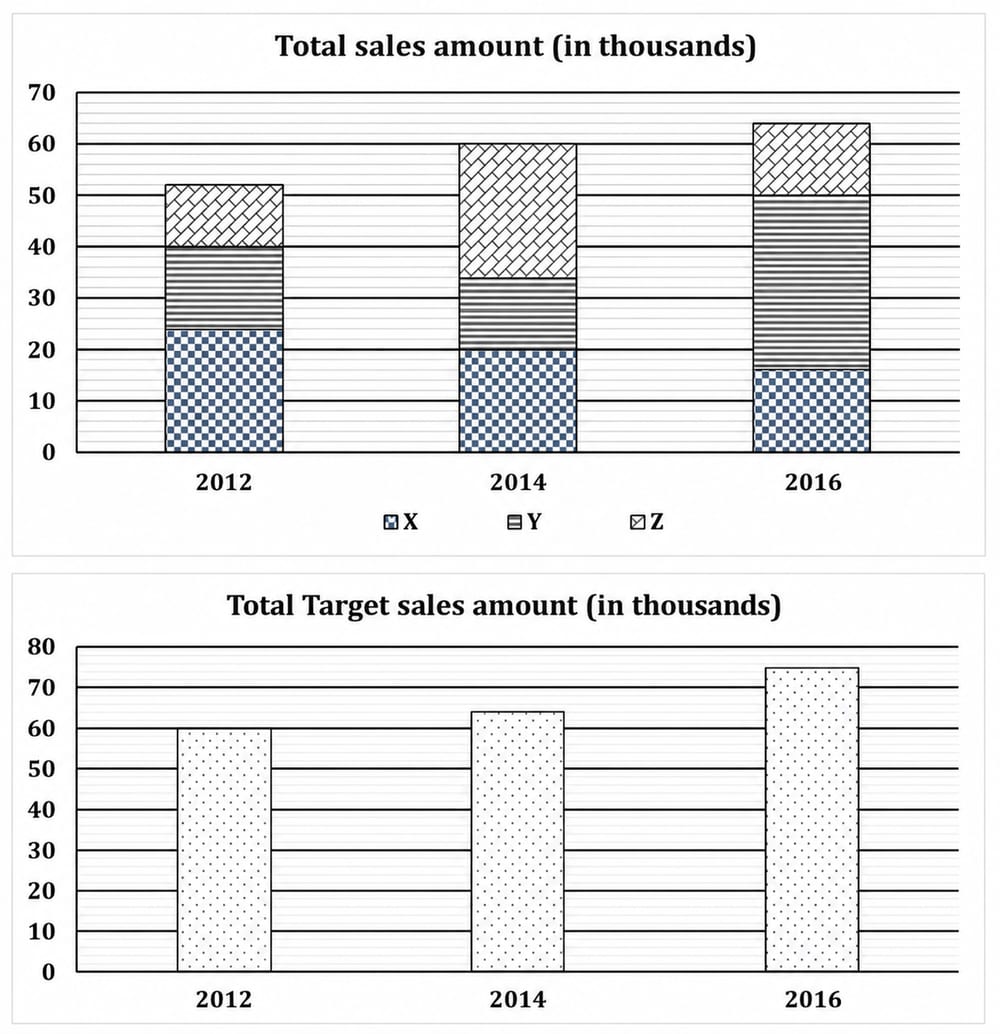
If sales amount of company X and Y in 2012 increases by 20% and 25% respectively and sales amount of company Z remains constant, then find the difference between total target sales amount of all these companies in 2012 and sales amount of these 3 companies together as per the above condition?(in Rs.)
Answer: A. 800 — ConceptA stacked bar gives each company's share within a year's total, so a single year's value for X, Y, or Z is the height of its own band (top boundary…
- A.
800
- B.
8000
- C.
8800
- D.
6000
- E.
3000
Attempted by 10 students.
Show answer & explanation
Correct answer: A
Concept
A stacked bar gives each company's share within a year's total, so a single year's value for X, Y, or Z is the height of its own band (top boundary minus bottom boundary), not the bar's overall height. To apply a percentage change to a quantity Q, the new value is Q×(1 + r/100); an unchanged quantity keeps its original value. The required "difference" is then |target − revised actual| for the same year.
Reading the 2012 values (in thousands)
From the first (sales) bar for 2012, reading each band by its boundaries:
Company X = 24 (band 0 to 24)
Company Y = 16 (band 24 to 40)
Company Z = 12 (band 40 to 52)
From the second (target) bar, the combined target for 2012 = 60.
Application — apply the percentage changes
X rises 20%: 24 × 1.20 = 28.8
Y rises 25%: 16 × 1.25 = 20
Z constant: 12
Revised combined sales = 28.8 + 20 + 12 = 60.8 (thousand)
Result
Difference = combined target − revised combined sales = 60 − 60.8 = −0.8 thousand; in magnitude that is 0.8 thousand = Rs 800.
Cross-check
Work in rupees throughout: target = 60,000; revised sales = 60,800; |60,000 − 60,800| = 800. Both routes agree, confirming the units were carried as thousands → rupees consistently.