The bar graph below shows the amount of tax (in '000) paid by three people,…
2022
The bar graph below shows the amount of tax (in '000) paid by three people, Tarun, Apurv and Mayank, in the years 2018 and 2019. Study the data carefully and answer the question.
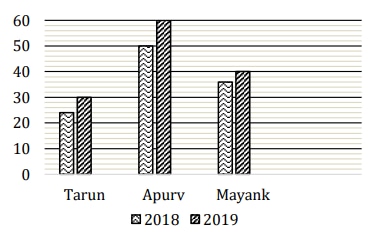
Find the difference between the total tax paid by Apurv in both years and the total tax paid by Mayank and Tarun in 2019.
Answer: D. 40000 Rs. — ConceptIn a grouped bar graph, each labelled bar gives one value on the vertical scale. To compare two collections of quantities, first read each required bar…
- A.
35000 Rs.
- B.
20000 Rs.
- C.
50000 Rs.
- D.
40000 Rs.
- E.
30000 Rs.
Attempted by 76 students.
Show answer & explanation
Correct answer: D
Concept
In a grouped bar graph, each labelled bar gives one value on the vertical scale. To compare two collections of quantities, first read each required bar from the axis, then add the values within each collection separately, and finally subtract the smaller total from the larger total. Reading the correct bar (right person, right year) is the whole task; the arithmetic is simple addition and subtraction.
Reading the bars
From the graph, the tax amounts (in '000) are:
Person | 2018 | 2019 |
|---|---|---|
Tarun | 25 | 30 |
Apurv | 50 | 60 |
Mayank | 35 | 40 |
Application
Apurv's total over both years = 50 + 60 = 110 (in '000).
Mayank's and Tarun's tax in 2019 = 40 + 30 = 70 (in '000).
Required difference = 110 − 70 = 40 (in '000) = 40,000.
Cross-check
Read back: the larger total is Apurv's 110, the smaller is the 2019 pair 70, and 70 + 40 = 110, so the gap of 40 (i.e. 40,000) is consistent. Note that Apurv's value uses both years while Mayank and Tarun contribute only their 2019 bars — mixing in a wrong year or a wrong person changes the totals.