Directions : first bar graph shows total sales amount of three different…
2019
Directions : first bar graph shows total sales amount of three different companies in three different years and second bar graph shows the combined target sales amount of these 3 companies in these 3 years.
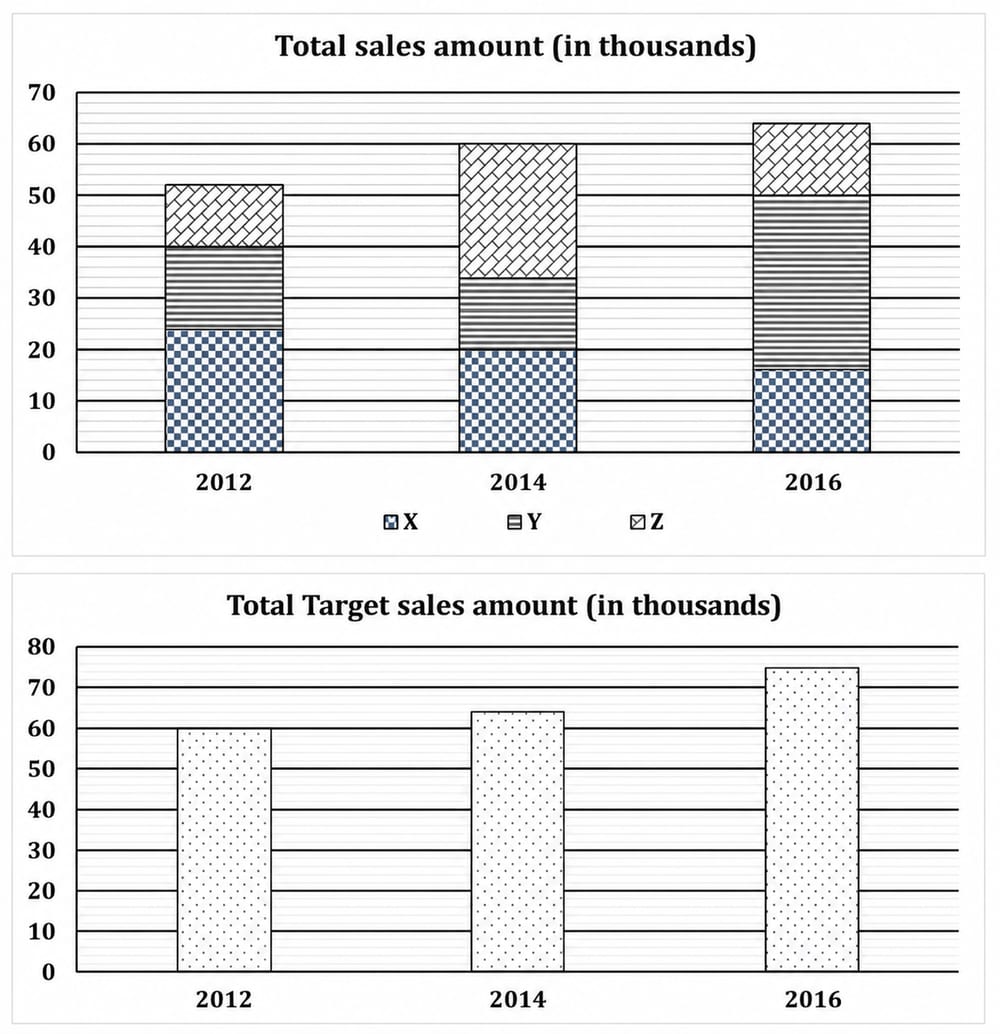
Sales amount of company Y in 2014 is what percent of total target sales amount of all companies together in 2016?
Answer: C. 18 2⁄3% — ConceptA “what percent of” question asks for (part ÷ whole) × 100. The PART is the quantity named first in the sentence; the WHOLE is the reference quantity…
- A.
11 1⁄9%
- B.
14 2⁄7%
- C.
18 2⁄3%
- D.
8 1⁄3%
- E.
16 2⁄3%
Attempted by 10 students.
Show answer & explanation
Correct answer: C
Concept
A “what percent of” question asks for (part ÷ whole) × 100. The PART is the quantity named first in the sentence; the WHOLE is the reference quantity that follows the words “percent of”. Read each value off the correct bar and the correct segment before dividing.
Application
Identify the PART — sales of company Y in 2014. In the stacked “Total sales” graph, the Y band (middle segment) in 2014 runs from 20 up to 34, so Y in 2014 = 34 − 20 = 14 (thousand).
Identify the WHOLE — total target sales of all companies together in 2016. In the “Total Target sales” graph, the 2016 bar reads 75 (thousand).
Form the ratio and convert to a percentage: (14 ÷ 75) × 100.
14 ÷ 75 = 0.18666…, so × 100 = 18.6̅% = 18 ⅔%.
Cross-check
Multiply back: 18⅔% of 75 = (56/3) % × 75 = (56 × 75) ÷ 300 = 14, which is exactly Y’s 2014 value — confirming 18 ⅔%.