Direction : Read the data carefully and answer the questions. Note: (i) Market…
2021
Direction : Read the data carefully and answer the questions.
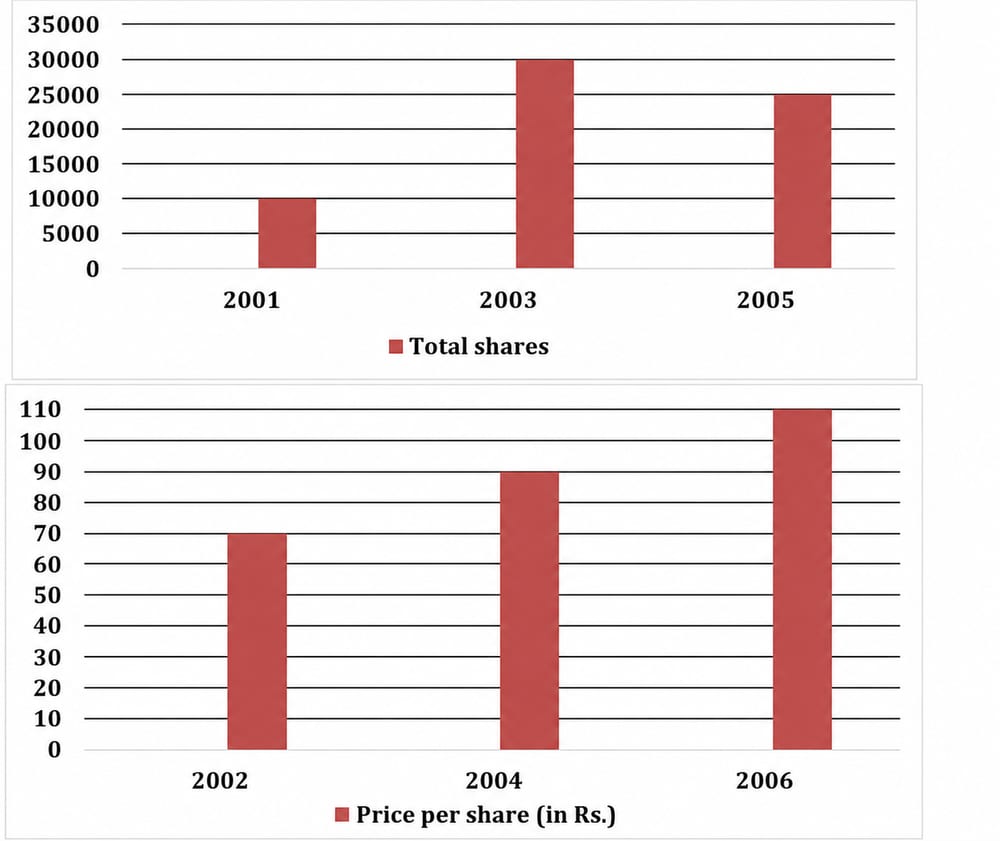
Note: (i) Market value = Total number of shares × price of one share
(ii) Number of shares increased by 20% from 2001 to 2002 and price of share decreased by 5% from 2002 to 2003. (iii) Price of share decreased by 12% from 2005 to 2006 and number of shares decreased by 10% 2005 to 2006.
If total number shares in 2004 are 1750 more than average number of shares in 2003 and 2006, then find average number of shares from 2001 to 2006.
Answer: B. 21250 — ConceptIn a successive-percentage data set, each missing yearly value is rebuilt from a known base by applying the stated change: a value that rises by r% is…
- A.
20250
- B.
21250
- C.
22250
- D.
23250
- E.
19250
Attempted by 11 students.
Show answer & explanation
Correct answer: B
Concept
In a successive-percentage data set, each missing yearly value is rebuilt from a known base by applying the stated change: a value that rises by r% is multiplied by (1 + r/100), and a value that falls by r% is multiplied by (1 − r/100). The arithmetic mean of a series equals the sum of all its terms divided by the number of terms. Only the quantity asked about — here the number of shares — enters the computation; the price data is unrelated to this question.
Application
Read the three given share counts from the chart and rebuild the three missing years one step at a time:
Known from chart: shares are 10000 (2001), 30000 (2003) and 25000 (2005).
Shares in 2002 (rises 20% over 2001): 10000 × 1.20 = 12000.
Shares in 2006 (falls 10% below 2005): 25000 × 0.90 = 22500.
Average of 2003 and 2006 shares: (30000 + 22500) ÷ 2 = 26250.
Shares in 2004 (1750 more than that average): 26250 + 1750 = 28000.
Add all six years: 10000 + 12000 + 30000 + 28000 + 25000 + 22500 = 127500.
Divide by 6 years: 127500 ÷ 6 = 21250.
Year-by-year shares
Year | Number of shares | How obtained |
|---|---|---|
2001 | 10000 | from chart |
2002 | 12000 | 10000 × 1.20 |
2003 | 30000 | from chart |
2004 | 28000 | 26250 + 1750 |
2005 | 25000 | from chart |
2006 | 22500 | 25000 × 0.90 |
Cross-check
Re-add the six values grouped differently: (10000 + 30000 + 25000) from the chart = 65000, plus the three derived years (12000 + 28000 + 22500) = 62500, giving 65000 + 62500 = 127500; dividing by 6 again returns 21250, confirming the result.