Directions : first bar graph shows total sales amount of three different…
2019
Directions : first bar graph shows total sales amount of three different companies in three different years and second bar graph shows the combined target sales amount of these 3 companies in these 3 years.
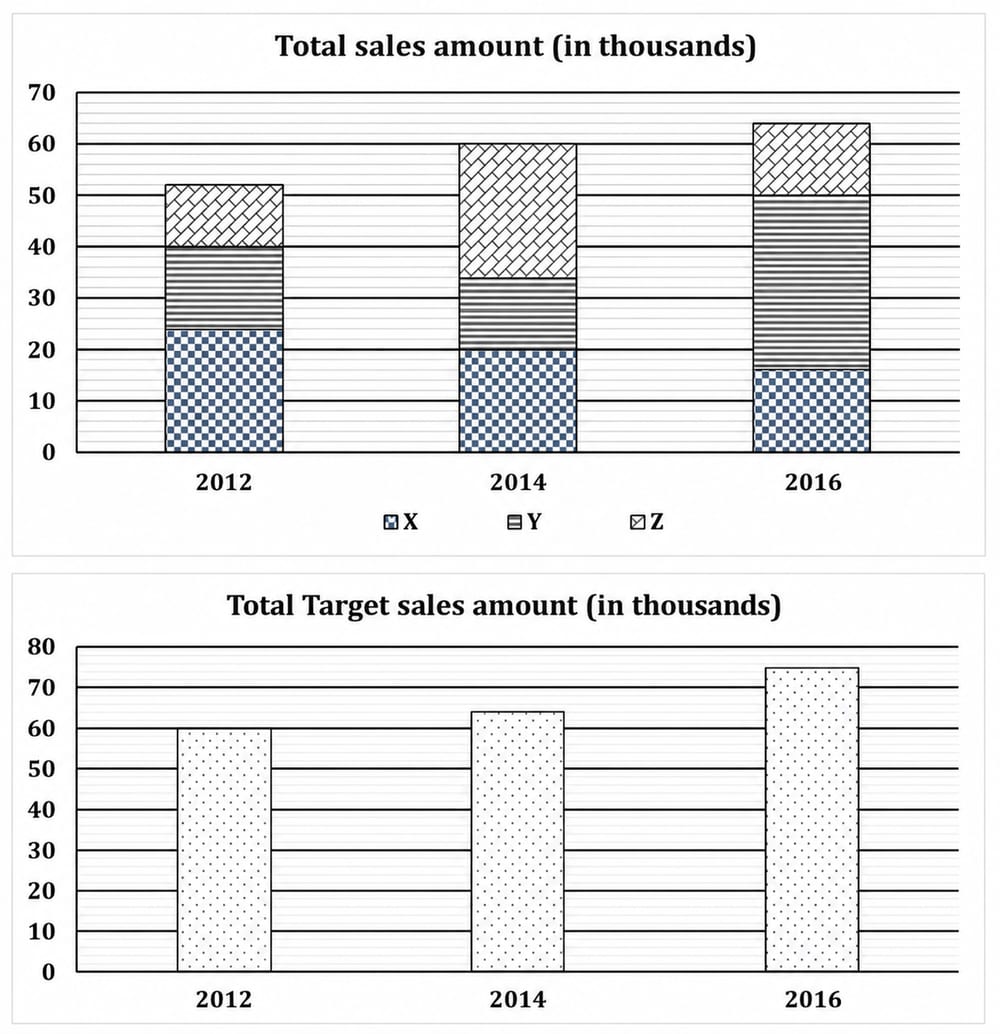
If the ratio of sales amount of company Y in 2016 to that of in 2018 is 17:15, then find the average of sale amount of company Y in 2014, 2016 and 2018?(in Rs.)
Answer: D. 26000 — ConceptThe average of a set of values equals their sum divided by the count of values: Average = (sum of all values) / (number of values). When a value is not…
- A.
24000
- B.
25500
- C.
27000
- D.
26000
- E.
26500
Attempted by 10 students.
Show answer & explanation
Correct answer: D
Concept
The average of a set of values equals their sum divided by the count of values: Average = (sum of all values) / (number of values). When a value is not given directly but only as a ratio to a known value, recover it first: if A : B = p : q and A is known, then B = A x q / p. Read each company's figure from its own band in the stacked bar (the band's height = its top boundary minus the band below it).
Application
Read company Y's band (the horizontal-line segment) for 2014: its band runs from 20 to 34 on the scale, so Y in 2014 = 34 - 20 = 14 (thousand).
Read company Y's band for 2016: its band runs from 16 to 50, so Y in 2016 = 50 - 16 = 34 (thousand).
2018 is not on the graph; it is given by the ratio Y(2016) : Y(2018) = 17 : 15. So Y(2018) = Y(2016) x 15 / 17 = 34 x 15 / 17 = 30 (thousand).
Sum the three Y figures: 14 + 34 + 30 = 78 (thousand).
Divide by 3 years: 78 / 3 = 26 (thousand) = Rs 26000.
Cross-check
Verify the ratio step: 34 : 30 = 17 : 15 (divide both by 2), which matches the given ratio, confirming Y(2018) = 30. The three values 14, 34, 30 sum to 78, and 78 / 3 = 26, so the average sale of company Y over the three years is Rs 26000.