Directions : first bar graph shows total sales amount of three different…
2019
Directions : first bar graph shows total sales amount of three different companies in three different years and second bar graph shows the combined target sales amount of these 3 companies in these 3 years.
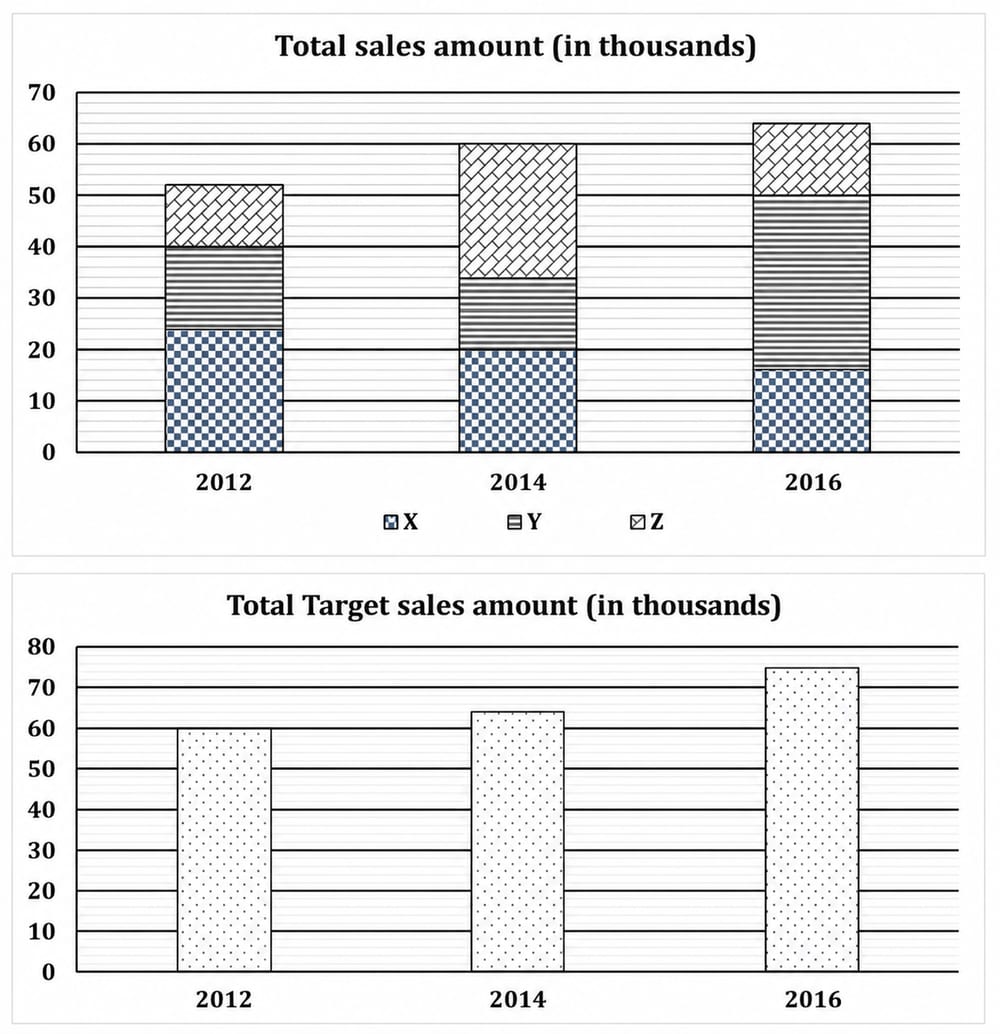
If the total target sales amount of all companies together in 2018 is 20% more than that of in 2016 and sales amount of company X and company Y in 2018 increases by 50% and 20% respectively than that of in 2016, then find by what percent sales amount of company Z be increased from 2016 to 2018 just to meet the total target sales amount of all companies together in 2018?
Answer: B. 80% — ConceptA target-gap problem fixes the TOTAL that the three parts must add up to, then back-solves the unknown part. If the required total is T and two parts…
- A.
70%
- B.
80%
- C.
75%
- D.
50%
- E.
90%
Attempted by 7 students.
Show answer & explanation
Correct answer: B
Concept
A target-gap problem fixes the TOTAL that the three parts must add up to, then back-solves the unknown part. If the required total is T and two parts are known after their changes, the third part needed = T minus those two. Its percentage change is (needed value - base value) / base value x 100. Read each component's value from the stacked bar as the height of its own band (top of the band minus the band below it).
Reading the graph (base-year values)
From the stacked sales bar for the base year, the three companies' sales are:
Company X = 16 (thousand)
Company Y = 34 (thousand) [band from 16 up to 50]
Company Z = 14 (thousand) [band from 50 up to 64]
From the target bar, the base-year combined target = 75 (thousand).
Application
Projected total target = base target increased by 20% = 75 x 1.20 = 90.
Projected X = 16 increased by 50% = 16 x 1.50 = 24.
Projected Y = 34 increased by 20% = 34 x 1.20 = 40.8.
Z required so the three meet the total target = 90 - 24 - 40.8 = 25.2.
Percent increase in Z = (25.2 - 14) / 14 x 100 = 11.2 / 14 x 100 = 80%.
Cross-check
Plug back: X + Y + Z = 24 + 40.8 + 25.2 = 90, which equals the projected total target. The arithmetic closes exactly, so Z must rise by 80%.