The bar graph shows the total item manufactured by four companies A, B, C and…
2025
The bar graph shows the total item manufactured by four companies A, B, C and D. It also shows the total item sold by these companies.
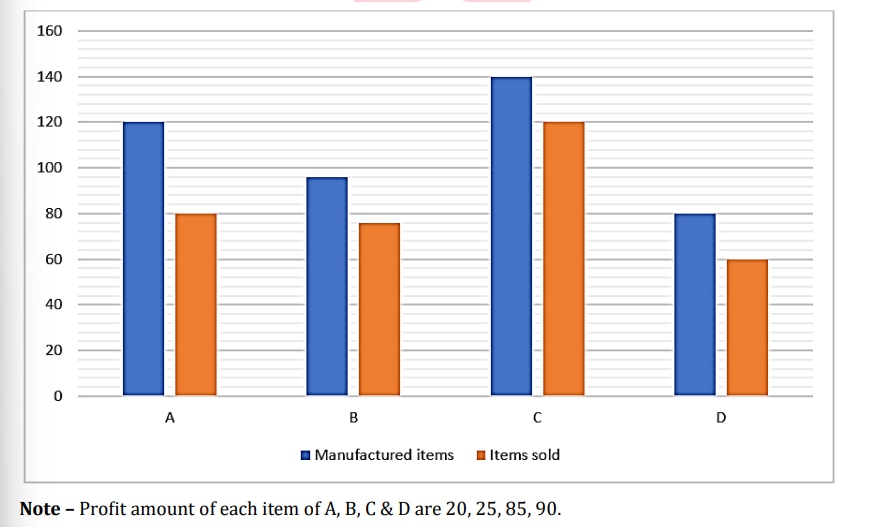
Unsold items of A, B and C is what percentage of total items sold by C.
Answer: B. 66.66% — ConceptUnsold items of a company = Manufactured items − Items sold. To express one quantity as a percentage of another, divide the part by the chosen base and…
- A.
42%
- B.
66.66%
- C.
40%
- D.
32%
- E.
33.33%
Attempted by 14 students.
Show answer & explanation
Correct answer: B
Concept
Unsold items of a company = Manufactured items − Items sold. To express one quantity as a percentage of another, divide the part by the chosen base and multiply by 100: percentage = (part / base) × 100. Here the base is fixed by the question — the items sold by company C — so identify that denominator carefully before dividing.
Application
Read the bar graph for A, B and C, then subtract sold from manufactured to get unsold for each:
Company A: 120 manufactured − 80 sold = 40 unsold.
Company B: 95 manufactured − 75 sold = 20 unsold.
Company C: 140 manufactured − 120 sold = 20 unsold.
Total unsold of A, B and C = 40 + 20 + 20 = 80.
Items sold by C (the required base) = 120.
Required percentage = (80 / 120) × 100 = 66.66% (approximately 66.67%).
Cross-check
Note that 80/120 = 2/3, and 2/3 of 100 is 66.66…, which confirms the result independently of the long division. The base must be C's SOLD count (120), not C's manufactured count (140) or any combined total — using a larger base would wrongly shrink the percentage.