The given graph shows the data of the students of five schools who appeared…
2023
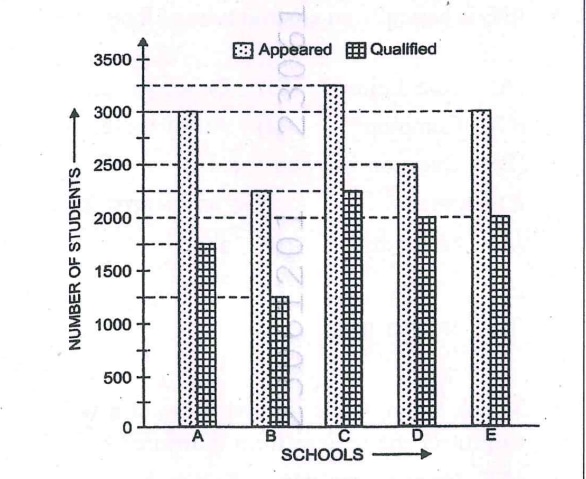
The given graph shows the data of the students of five schools who appeared and qualified in the Final Board Examinations. Study the graph carefully and answer the questions. Find out the total number of students of all the schools who could not qualify the Exam.
Answer: C. 4750 — To find the total number of students who did not qualify, we must first determine the number of students who failed in each school by subtracting the number…
- A.
4250
- B.
4500
- C.
4750
- D.
3750
- E.
Question not attempted
Attempted by 152 students.
Show answer & explanation
Correct answer: C
To find the total number of students who did not qualify, we must first determine the number of students who failed in each school by subtracting the number of qualified students from the total number of students who appeared.
Step-by-Step Analysis
The number of students who did not qualify for each school is calculated as: Appeared - Qualified = Did not qualify.
School A: 3000 - 1750 = 1250
School B: 2250 - 1250 = 1000
School C: 3250 - 2250 = 1000
School D: 2500 - 2000 = 500
School E: 3000 - 2000 = 1000
Total Calculation
To get the final answer, sum the failures from all schools:
1250 + 1000 + 1000 + 500 + 1000 = 4750
Therefore, the total number of students who could not qualify is 4750, which corresponds to Option C.