The given graph shows the data of the students of five schools who appeared…
2023
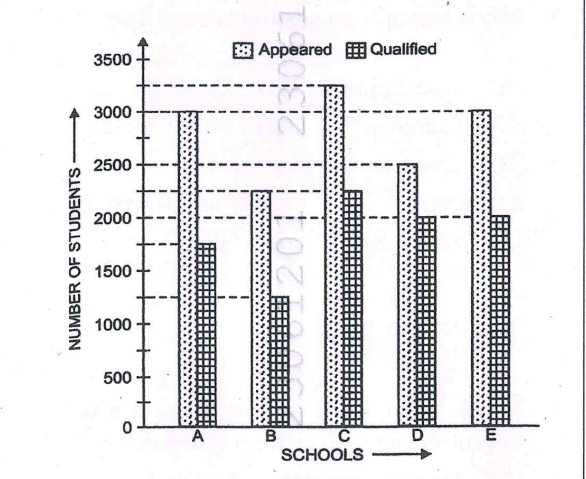
The given graph shows the data of the students of five schools who appeared and qualified in the Final Board Examinations. Study the graph carefully and answer the questions Find out the ratio of the number of students appeared in School A to School B .
Answer: D. 4 : 3 — To find the ratio of the number of students who appeared in School A to those who appeared in School B, we need to extract the values from the bar graph.…
- A.
3 : 4
- B.
2 : 3
- C.
5 : 3
- D.
4 : 3
- E.
Question not attempted
Attempted by 215 students.
Show answer & explanation
Correct answer: D
To find the ratio of the number of students who appeared in School A to those who appeared in School B, we need to extract the values from the bar graph.
Step-by-Step Analysis
Extract Data for School A: Look at the "Appeared" bar (the dotted bar) for School A. The height of this bar aligns with the 3000 mark on the Y-axis.
Extract Data for School B: Look at the "Appeared" bar (the dotted bar) for School B. The height of this bar aligns with the 2250 mark on the Y-axis.
Calculate the Ratio:
Ratio = (Appeared in School A) / (Appeared in School B)
Ratio = 3000 / 2250
To simplify, divide both by their greatest common divisor, which is 750:
3000 / 750 = 4
2250 / 750 = 3
The ratio is 4:3.