The given graph shows the data of the students of five schools who appeared…
2023
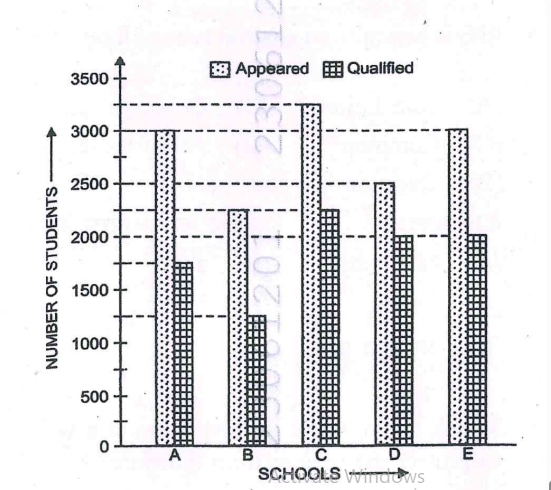
The given graph shows the data of the students of five schools who appeared and qualified in the Final Board Examinations. Study the graph carefully and answer the questions Average percentage of passed students of all schools is approximately :–
Answer: C. 66% — To find the average percentage of passed students across all schools, we need to calculate the passing percentage for each school individually and then find…
- A.
64%
- B.
65%
- C.
66%
- D.
70%
- E.
Question not attempted
Attempted by 102 students.
Show answer & explanation
Correct answer: C
To find the average percentage of passed students across all schools, we need to calculate the passing percentage for each school individually and then find their overall average.
Step-by-Step Analysis
Extract Data from Graph:
School A: Appeared = 3000, Qualified = 1750.
Percentage = (1750 / 3000) * 100 = 58.33%
School B: Appeared = 2250, Qualified = 1250.
Percentage = (1250 / 2250) * 100 = 55.56%
School C: Appeared = 3250, Qualified = 2250.
Percentage = (2250 / 3250) * 100 = 69.23%
School D: Appeared = 2500, Qualified = 2000.
Percentage = (2000 / 2500) * 100 = 80.00%
School E: Appeared = 3000, Qualified = 2000.
Percentage = (2000 / 3000) * 100 = 66.67%
Calculate the Average:
Sum of percentages = 58.33 + 55.56 + 69.23 + 80.00 + 66.67 = 329.79%
Average percentage = 329.79 / 5 = 65.958%
This value is approximately 66%.