The bar graph shows the total item manufactured by four companies A, B, C and…
2025
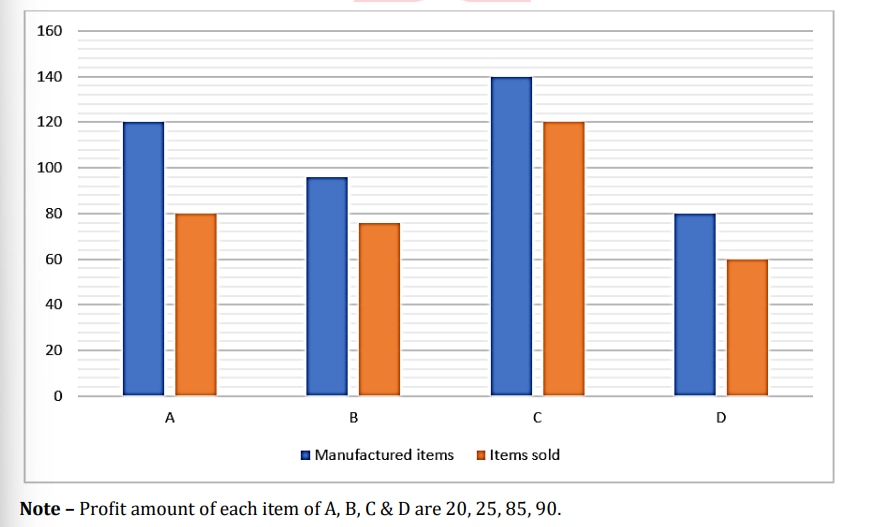
The bar graph shows the total item manufactured by four companies A, B, C and D. It also shows the total item sold by these companies.
Find the ratio of items sold by A and B together to unsold items of C and D together.
Answer: A. 39:10 — ConceptIn a manufactured-vs-sold bar chart, the quantity actually moved is read directly off the relevant bar, and the quantity left over (unsold) is the…
- A.
39:10
- B.
20:19
- C.
40:41
- D.
32:39
- E.
22:21
Attempted by 13 students.
Show answer & explanation
Correct answer: A
Concept
In a manufactured-vs-sold bar chart, the quantity actually moved is read directly off the relevant bar, and the quantity left over (unsold) is the manufactured amount minus the sold amount for the same company. A ratio between two such groups is formed by summing the required quantities for each group and then reducing the fraction by their greatest common divisor.
Reading the values from the graph
A: manufactured = 120, sold = 80
B: manufactured = 96, sold = 76
C: manufactured = 140, sold = 120
D: manufactured = 80, sold = 60
Application
Items sold by A and B together = 80 + 76 = 156.
Unsold items of C = manufactured - sold = 140 - 120 = 20.
Unsold items of D = manufactured - sold = 80 - 60 = 20.
Unsold items of C and D together = 20 + 20 = 40.
Required ratio = 156 : 40. Divide both terms by their GCD, 4: 156 / 4 = 39 and 40 / 4 = 10, giving 39 : 10.
Cross-check
Reverse the reduction: 39 x 4 = 156 and 10 x 4 = 40, which reproduces 156 : 40, the un-reduced ratio. The profit figures printed in the note below the graph are not needed here, since the question asks only about sold and unsold quantities.
Required ratio = 39 : 10.