

Gantt Charts, PERT and CPM: 9 MCQs and 1 Solved Problem
Solve a subjective PERT problem and nine MCQs on scheduling tools, critical paths, concurrency, slack and crashing, with fresh step-by-step explanations.
KnowledgeGate Team
Exam prep & CS education
Updated 12 Nov 20267 min read

Gantt charts use calendar bars; PERT uses networks and three-time estimates; CPM identifies critical paths, slack and crashing. Knowing that PERT handles uncertainty is not enough for forward passes or tied paths. Answer first, then check the arithmetic.
These three tools recur across UGC NET CS Exam Preparation and the other computer-science teaching papers, so separate them cleanly before you start.
1. Gantt, PERT and CPM distinctions to make before solving
Tool | Main representation | What it tells you |
|---|---|---|
Gantt chart | Calendar bars | Start, finish, overlap and progress |
PERT | Network with O, M and P estimates | Uncertain activity time |
CPM | Duration network | Critical path, slack and crashing |
Use Tₑ=(O+4M+P)/6, σ=(P-O)/6, variance=σ², and slack=LS-ES=LF-EF. The longest valid path is critical; its duration is the shortest feasible project time.
A takes 3 days; B takes 4 and C takes 6 in parallel; D takes 2 after both. A-B-D=3+4+2=9; A-C-D=3+6+2=11. Thus A-C-D is critical and B has 11-9=2 slack. Gantt bars are A 0-3, B 3-7, C 3-9 and D 9-11. For longer model derivations, work through Estimation and Scheduling in Software Engineering: COCOMO, PERT and CPM Worked Examples. Then use the questions below to test tool choice, concurrency, slack and crashing.
2. PERT questions 1-2: expected time, uncertainty and tool choice
Question 1, subjective problem
A project manager is comparing two different modules for the Critical Path. Both modules have the same Most Likely (M) completion time of 10 days.
Module A (Stable): Optimistic (O) = 9 days, Pessimistic (P) = 11 days.
Module B (Research-Heavy): Optimistic (O) = 2 days, Pessimistic (P) = 24 days.
The manager argues that since the Most Likely time is the same for both, it doesn’t matter which one is on the Critical Path. Use the PERT Expected Time (Tₑ) and Standard Deviation (σ) formulas to show why Module B carries much more schedule risk even though its expected time is similar.
For A: Tₑ=(9+4(10)+11)/6=60/6=10 days; σ=(11-9)/6=2/6=1/3 day; variance=(1/3)²=1/9 day².
For B: Tₑ=(2+4(10)+24)/6=66/6=11 days; σ=(24-2)/6=22/6=11/3 days; variance=(11/3)²=121/9 day².
B adds 1 expected day, but its standard deviation is 11 times A's and its variance 121 times A's, making it riskier.
Question 2
Exam: UPPSC Polytechnic Lecturer 2018.
Which of the following can be used to track the tasks of a project, when the estimation of task time is fairly uncertain?
(a) Decision table
(b) Case tools
(c) DFD
(d) PERT
Answer: (d) PERT. PERT combines O, M and P for uncertain times. Decision tables model rules, CASE tools support development, and DFDs show data movement.
3. Questions 3-5: critical-path meaning, chart conversion and activity networks
Question 3
Exam: TPSC System Analyst 2026.
In project management, the 'Critical Path' refers to
(a) The shortest possible time to complete the project
(b) The sequence of tasks that determines the project's finish date
(c) Tasks that are more likely to fail
(d) The list of tasks with low budgets
Answer: (b) The sequence of tasks that determines the project's finish date. The longest dependency path controls the finish. Option A gives a time, not the sequence. Above, A-C-D takes 11 days.
Question 4
Exam: DSSSB TGT Shift 1 2021.
Which of the following statement(s) is/are correct regarding software project management?
I. PERT charts can be derived automatically from Gantt charts.
II. Gantt charts cannot be automatically derived from PERT charts.
(a) Only I
(b) Only II
(c) Both I and II
(d) Neither I nor II
Answer: (d) Neither I nor II. A Gantt chart may omit data needed to rebuild PERT, so I can fail. PERT activities, durations and dependencies can form Gantt bars, so II can fail.
Question 5
Exam: UGC NET Paper 2 (December) 2019.
An _______ chart is a project schedule representation that presents a project plan as a directed graph. The critical path is the __________ sequence of ________ tasks and it defines project ________.
(a) Activity, Shortest, Independent, Cost
(b) Activity, Longest, Dependent, Duration
(c) Activity, Longest, Independent, Duration
(d) Activity, Shortest, Dependent, Duration
Answer: (b) Activity, Longest, Dependent, Duration. Activity charts are directed, paths follow dependent tasks, and the longest path controls duration. See Software Quality in Software Engineering.
4. Questions 6-7: concurrency and a full CPM forward pass
Question 6
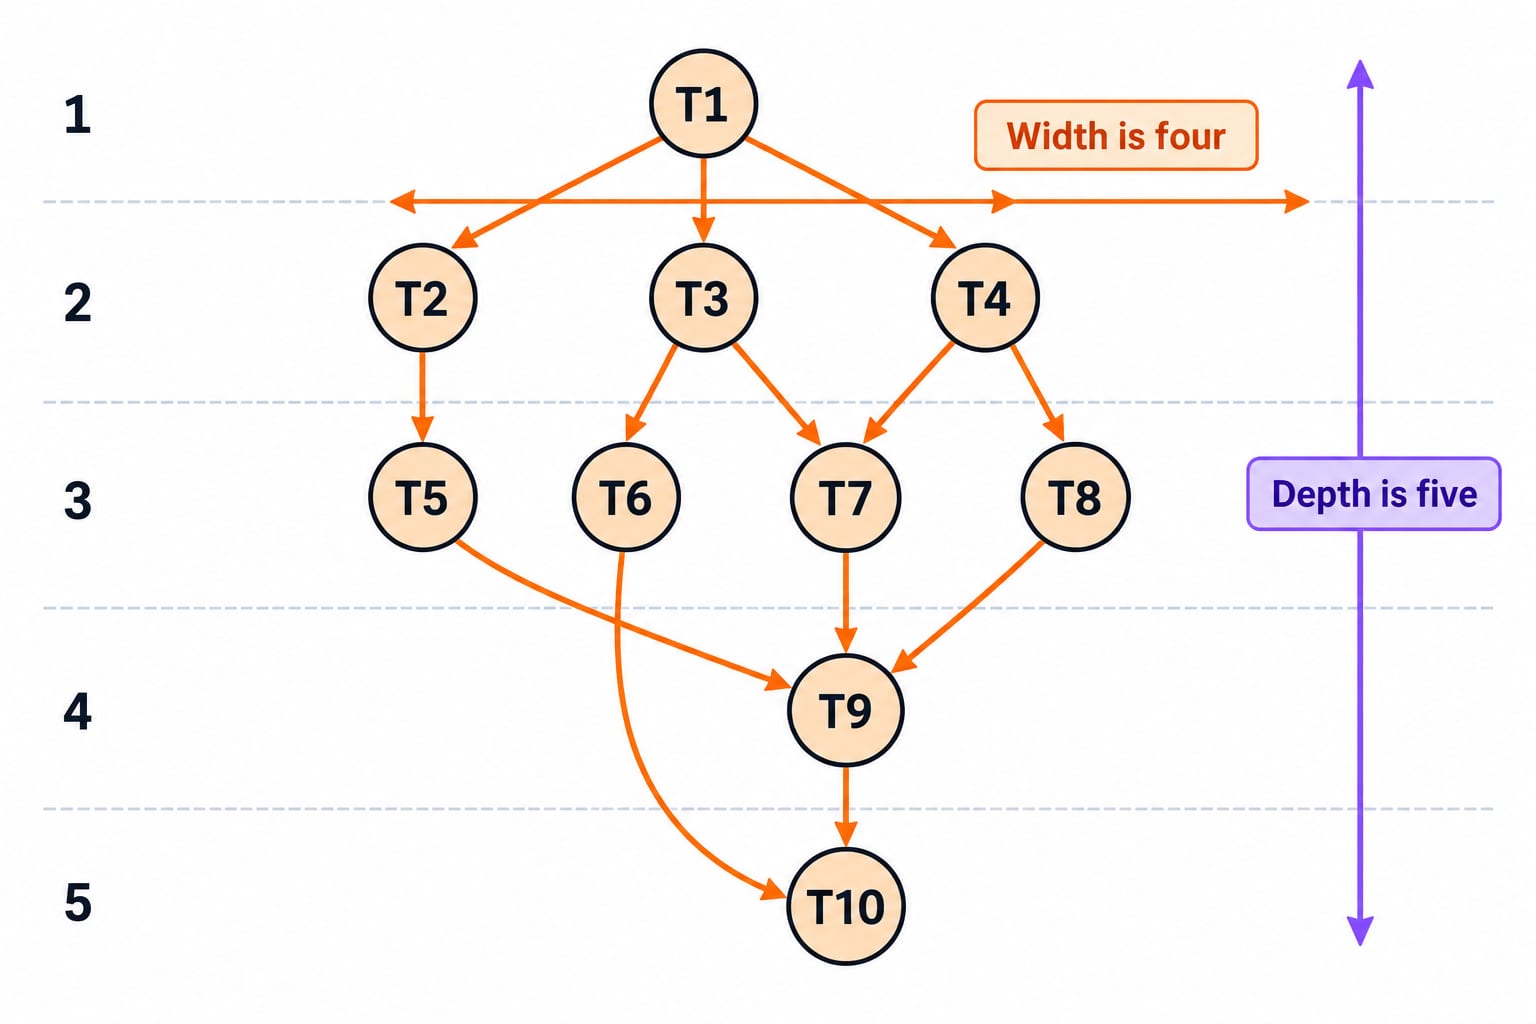
A software project plan has identified ten tasks with dependencies as given below:
Task | Depends on |
|---|---|
T1 | - |
T2 | T1 |
T3 | T1 |
T4 | T1 |
T5 | T2 |
T6 | T3 |
T7 | T3, T4 |
T8 | T4 |
T9 | T5, T7, T8 |
T10 | T6, T9 |
Answer the following questions:
(Q1) What is the maximum number of tasks that can be done concurrently?
(Q2) What is the minimum time required to complete the project, assuming that each task requires one time unit and there is no restriction on the number of tasks that can be done in parallel?
(a) 5, 5
(b) 4, 5
(c) 5, 4
(d) 4, 4
Answer: (b) 4, 5. Schedule 1:T1; 2:T2,T3,T4; 3:T5,T6,T7,T8; 4:T9; 5:T10. T7 waits for T3 and T4; T9 waits for T5, T7 and T8. Width is four; depth is five.
Question 7
Consider the CPM activity chart where an arc connecting two milestones is labeled with a task identifier and the time taken in days. For example in order to go from A to B, task T1 takes 180 days. A dashed line depicts an additional dependency that is equivalent to a zero time task.
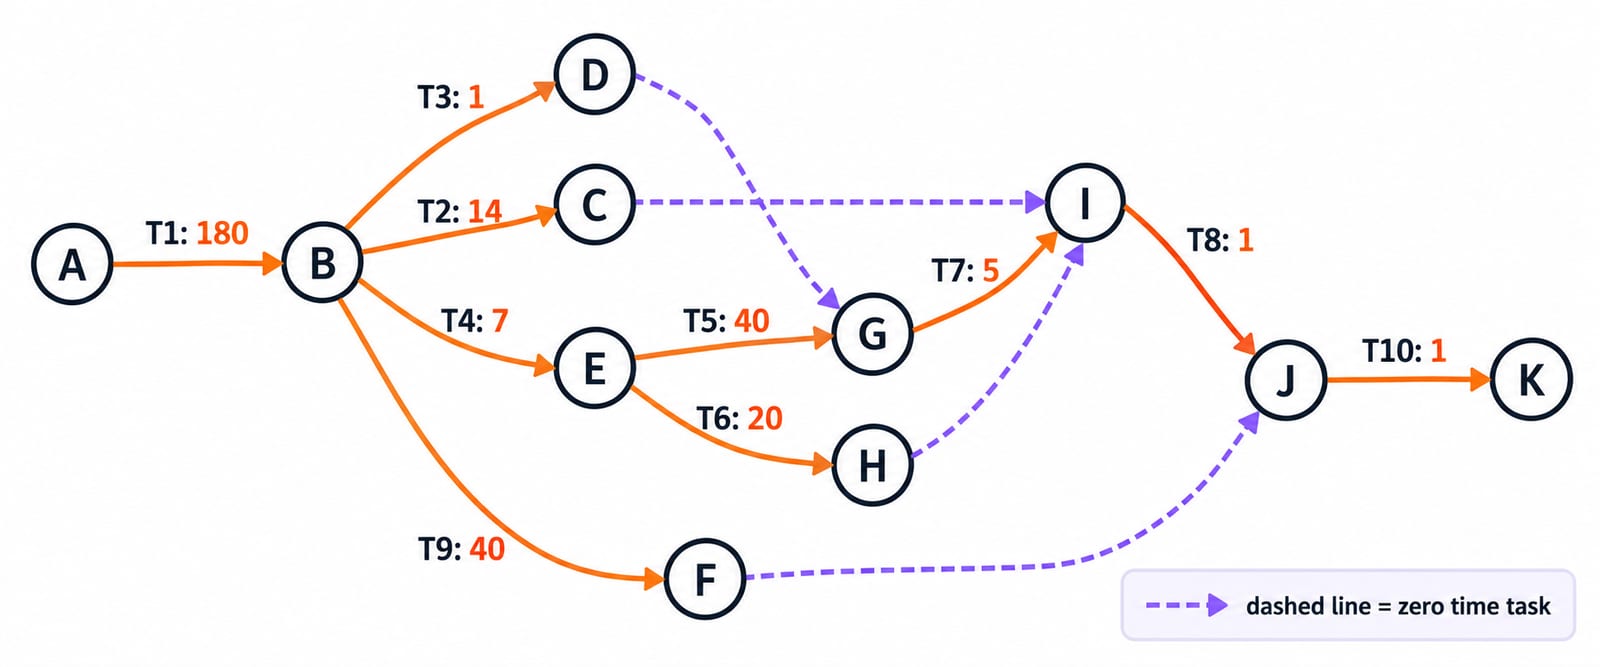
The set of activities that lie on the critical path are
(a) T1, T2, T8, T10
(b) T1, T3, T8, T10
(c) T1, T2, T3, T4, T5, T6, T7, T8, T9, T10
(d) T1, T4, T5, T7, T8, T10
Answer: (d) T1, T4, T5, T7, T8, T10. Forward pass: A=0, B=180, C=194, D=181, E=187, F=220, G=max(181,187+40)=227, H=207, I=max(194,227+5,207)=232, J=max(232+1,220)=233, K=233+1=234. Backtrack A-B-E-G-I-J-K for T1, T4, T5, T7, T8, T10. T1-T2 reaches I at 194, not 232.
5. Questions 8-10: slack, PERT path length and crashing
Question 8
A software project involves execution of 5 tasks T₁, T₂, T₃, T₄ and T₅ of duration 10, 15, 18, 30 and 40 days, respectively. T₂ and T₄ can start only after T₁ completes. T₃ can start after T₂ completes. T₅ can start only after both T₃ and T₄ complete. What is the slack time of task T₃ in days?
(a) 0
(b) 3
(c) 18
(d) 30
Answer: (a) 0. T1-T2-T3-T5=10+15+18+40=83; T1-T4-T5=10+30+40=80. T3 is critical, so its slack is 0. The 3-day gap is T4's slack.
Question 9
A software project has four phases P1, P2, P3 and P4. P1 is the first phase and must be completed before any other phase can start. Phases P2 and P3 can be executed in parallel. Phase P4 cannot start until both P2 and P3 are completed.
The optimistic, most likely, and pessimistic estimates of the phase completion times in days for P1, P2, P3 and P4 are respectively:
P1: (11, 15, 25)
P2: (7, 8, 15)
P3: (8, 9, 22)
P4: (3, 8, 19)
The critical path for the above project and the slack of P2 are, respectively:
(a) P1-P2-P4, 1 day
(b) P1-P3-P4, 1 day
(c) P1-P3-P4, 2 days
(d) P1-P2-P4, 2 days
Answer: (c) P1-P3-P4, 2 days. P1=(11+4(15)+25)/6=16, P2=(7+4(8)+15)/6=9, P3=(8+4(9)+22)/6=11, P4=(3+4(8)+19)/6=9. So the paths are 34 and 36; P1-P3-P4 is critical and P2 has 36-34=2 slack.
Question 10
A software project has four phases P1, P2, P3 and P4. P1 is the first phase and must be completed before any other phase can start. Phases P2 and P3 can be executed in parallel. Phase P4 cannot start until both P2 and P3 are completed.
The optimistic, most likely, and pessimistic estimates of the phase completion times in days for P1, P2, P3 and P4 are respectively:
P1: (11, 15, 25)
P2: (7, 8, 15)
P3: (8, 9, 22)
P4: (3, 8, 19)
The costs in rupees per day of crashing the expected phase completion times for P1, P2, P3 and P4 are respectively 100, 2000, 50 and 1000. Assume that the expected phase completion times cannot be crashed below the respective most likely times.
The minimum and maximum amounts in rupees that can be spent on crashing so that all paths are critical are respectively:
(a) 100 and 1000
(b) 100 and 1200
(c) 150 and 1200
(d) 200 and 2000
Answer: (b) 100 and 1200. P3's branch is 36 days versus P2's 34. Crash P3 by 2 days: 2 x 50 = 100 minimum.
At 34 days, shorten shared phases only. P1 falls 16 to 15 for 1 x 100 = 100; P4 falls 9 to 8 for 1 x 1000 = 1000. Maximum: 100 + 100 + 1000 = 1200. Crashing P2 breaks the tie.
6. Answer key, recurring traps and the next practice step
Item | Answer |
|---|---|
Q1, subjective | A: |
Q2 | D |
Q3 | B |
Q4 | D |
Q5 | B |
Q6 | B, |
Q7 | D |
Q8 | A |
Q9 | C |
Q10 | B |
Check four traps: longest path versus shortest finish, bars versus stored dependencies, duration versus slack, and breaking a tie by crashing one branch.
Redraw Question 6 and recompute Questions 9 and 10. Continue with the NTA-UGC-NET Paper 2 Complete Course.
The short version
Use Gantt for calendars, PERT for uncertain durations, and CPM for paths, slack and crashing. Solve once unaided, then show every path.
Go deeper with the full courseUGC NET Computer Science (Paper 1 + Paper 2)
Keep learning
Estimation and Scheduling in Software Engineering: COCOMO, PERT and CPM Worked Examples
Follow one project from functional size to modelled effort and duration, then solve a dependency network, PERT uncertainty and schedule compression.
Updated 26 Jul 20267 min read82 viewsUGC NET Computer Science
SJF and SRTF Scheduling: Concepts, Gantt Charts and Worked Examples
Learn how non-preemptive SJF and preemptive SRTF schedule the same four processes, then calculate CT, TAT and WT while avoiding arrival, tie and Gantt-chart traps.
Updated 8 Nov 20265 min readOperating Systems

LJF and HRRN CPU Scheduling: Worked Gantt Charts, Formula and Exam Traps
Solve one five-process data set under non-preemptive LJF and HRRN, then compare every completion, turnaround, and waiting time.
Updated 4 Nov 20266 min readOperating Systems
FCFS Scheduling: Gantt Charts, Waiting Time and Exam Traps
Learn FCFS scheduling through a four-process trace, a complete metric table, convoy-effect reasoning, and checks for idle time, ties and context switches.
Updated 2 Nov 20265 min readOperating Systems