Ecosystem, Biomes and Environmental Issues for Teaching Exams: Energy Flow, Biome Clues and Pollution Traps
Build a clean concept map from pond components to energy pyramids, nitrogen cycling, biome classification, BOD, eutrophication and common teaching-exam traps.
KnowledgeGate Team
Exam prep & CS education
Updated 3 Aug 20266 min read2.9k views
Ecosystem, habitat, biome and biosphere seem interchangeable until a question tests their scale. Pollution questions test mechanisms, not just definitions.
For UGC NET Paper 1, CTET or TET EVS, and teaching recruitment, two checks settle most items: fix the scale before naming anything, and decide whether the question is about energy or matter. NET aspirants should also know how Paper 1 and Paper 2 differ.
Ecosystem Basics: From Organism to Biosphere
The scale is organism -> population -> community -> ecosystem -> biome -> biosphere. An ecosystem is biotic components interacting with abiotic components. Habitat means where an organism lives; niche means its functional role.
In a pond, water, sunlight, temperature and dissolved minerals are abiotic. Algae and Hydrilla are producers, zooplankton and insect larvae are consumers, and bacteria and fungi are decomposers. The pond is one ecosystem; a freshwater biome contains many ponds, lakes, rivers and wetlands.
Contrast | Correct distinction |
|---|---|
Habitat vs niche | Living place vs functional role |
Ecosystem vs biome | Local system vs broad ecosystem grouping |
Biotic vs abiotic | Living vs non-living components |
Population vs community | One species vs all populations in an area |
Food Chains, Food Webs and the Energy Pyramid
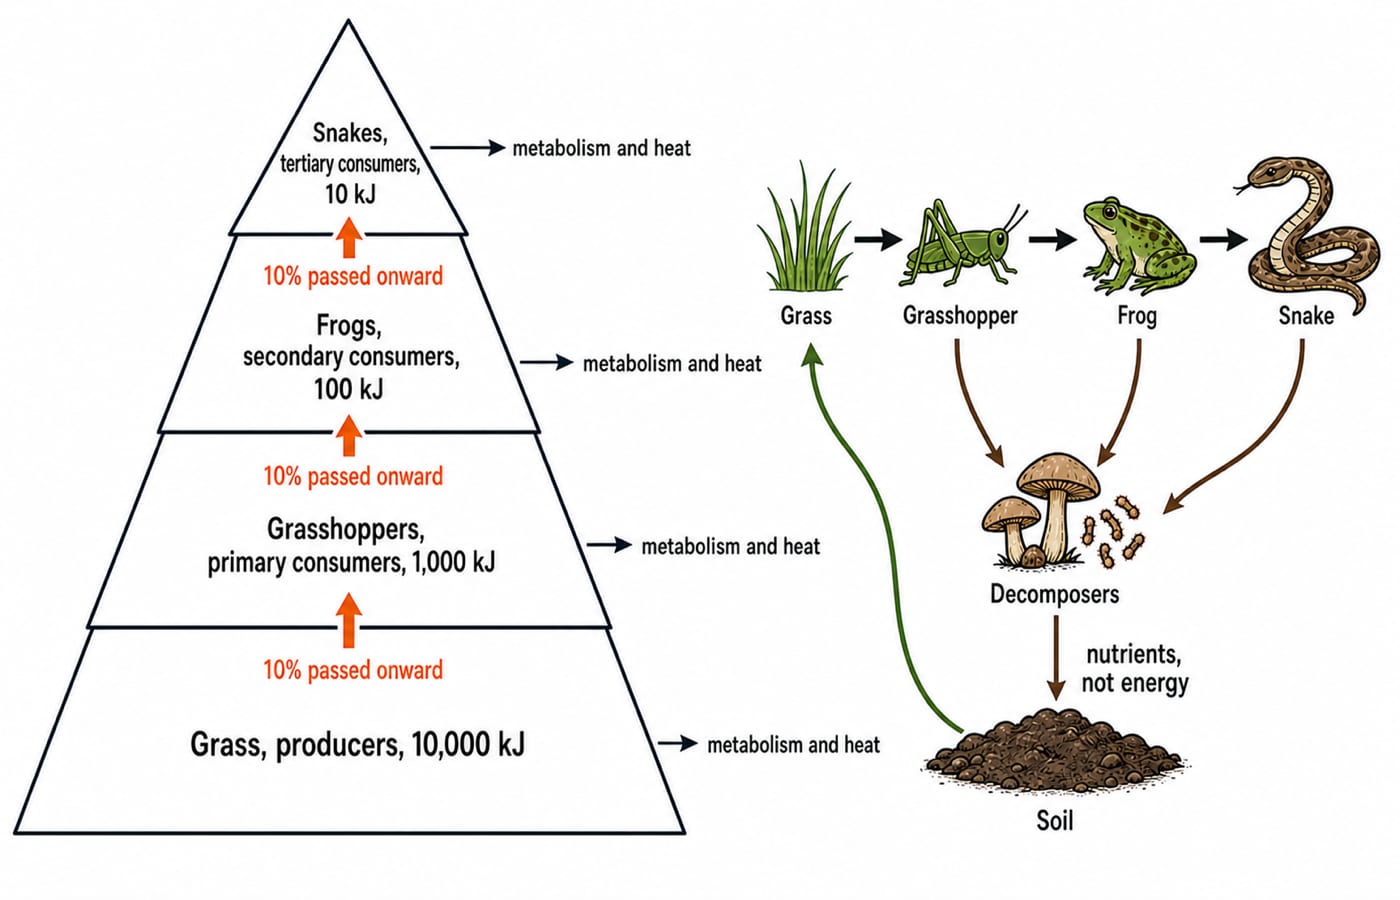
Producers capture energy; primary, secondary and tertiary consumers occupy successive levels; decomposers act on dead matter from every level. Grass -> grasshopper -> frog -> snake is a grazing chain. A detritus chain starts with dead matter. A food web joins chains and is usually more resilient because it offers alternative feeding routes.
Use the simplified 10% model step by step:
Grass stores 10,000 kJ.
Grasshoppers receive 10% of 10,000 = 1,000 kJ.
Frogs receive 10% of 1,000 = 100 kJ.
Snakes receive 10% of 100 = 10 kJ.
Energy not passed to the tertiary level = 10,000 - 10 = 9,990 kJ.
The 9,990 kJ is used or lost across earlier levels, mainly through metabolism and heat. The 10% rule is an exam model, not an exact natural rate. The energy pyramid is always upright, although number and biomass pyramids may not be. Matter cycles; energy flows one way.
Nutrient Cycles and Species Interactions
Carbon, water and nitrogen all cycle between living and non-living stores, each in a fixed order. Carbon runs atmospheric CO2 -> photosynthesis -> consumers -> respiration, decomposition or combustion -> CO2, with oceans, soil and fossil deposits as the long-term stores. Water runs evaporation and transpiration -> condensation -> precipitation -> runoff, infiltration and groundwater -> atmosphere, and needs no microbial conversion to become usable.
Nitrogen does need that conversion, so its chain is the longest: atmospheric N2 -> fixation -> NH3 or NH4+ -> nitrification to NO2- and then NO3- -> plant assimilation -> animals -> ammonification -> denitrification back to N2. Carbon and nitrogen are gaseous cycles with an atmospheric reservoir; phosphorus is sedimentary, held in rock and soil.
Rhizobium fixes nitrogen in a legume root nodule while the plant supplies carbohydrates: mutualism. A cattle egret eating insects disturbed by cattle shows commensalism. A tick on cattle is parasitism, a frog eating a grasshopper is predation, and two plants using one limited nitrate pool show competition.
Decision rule: both benefit, mutualism; one benefits and the other is unaffected, commensalism; one benefits and harms its host, parasitism. “Unaffected” is an exam model and is hard to prove perfectly in nature.
Biomes: Read Climate Clues Instead of Memorising Labels
Biome | Climate clue | Dominant vegetation | Representative adaptation |
|---|---|---|---|
Tropical rainforest | Warm, very wet | Evergreen forest | Broad leaves |
Grassland or savanna | Seasonal rain | Grasses, scattered trees | Fire tolerance |
Hot desert | Hot, very dry | Xerophytes | Water storage |
Temperate forest | Moderate, seasonal | Deciduous or mixed trees | Leaf fall |
Taiga | Long cold winter | Conifers | Needle leaves |
Tundra | Very cold, dry | Mosses, lichens, low shrubs | Low growth |
Freshwater and marine are aquatic groupings, where salinity, depth, light and water movement matter more than terrestrial rainfall labels.
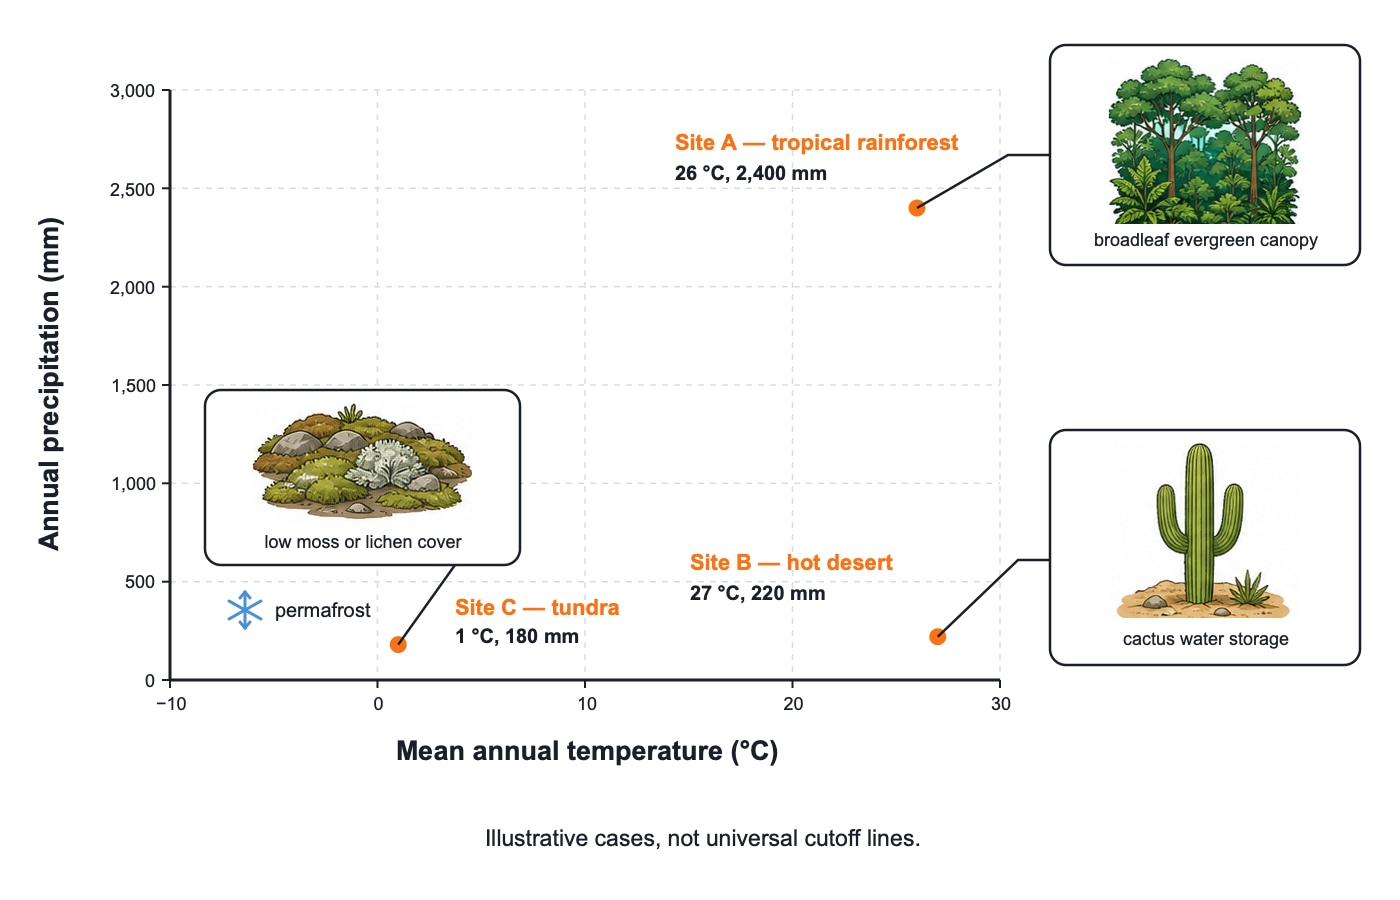
Classify three teaching cases, not universal cutoffs. Site A, 26 C and 2,400 mm annually, best fits dense evergreen tropical rainforest. Site B, 27 C and 220 mm, best fits hot desert with water-saving plants. Site C, 1 C, 180 mm and permafrost, best fits tundra with mosses, lichens and a short growing season. Climate selects the broad biome; local interactions describe an ecosystem. See the testing lens in CTET EVS content and pedagogy.
Environmental Issues: Trace Cause, Mechanism and Effect
Issue | Cause | Mechanism | Indicator | Response |
|---|---|---|---|---|
Warming | More greenhouse gases | More heat retained | Warming trend | Cut emissions, protect sinks |
Ozone depletion | CFCs and similar compounds | Stratospheric ozone destroyed | Thinner ozone layer | Control damaging substances |
Air, water, soil, noise pollution | Emission, discharge, dumping, sound | Harmful exposure | Medium-specific reading | Prevent and treat |
Eutrophication | Excess water nutrients | Bloom decomposition uses oxygen | Bloom, falling oxygen | Cut nutrient inflow |
Biomagnification | Persistent pollutant | Concentration rises by trophic level | High top-predator level | Control release |
Habitat loss | Clearing or fragmentation | Space and connectivity fall | Population decline | Protect and restore |
Biodiversity decline | Multiple pressures | Variety and abundance fall | Lower richness | Conserve and reduce pressure |
Solid waste | Poor disposal | Accumulation, leakage or burning | Waste and contamination | Reduce, segregate, recover |
Ozone depletion is not the enhanced greenhouse effect. In an undiluted BOD example, initial dissolved oxygen is 8.5 mg/L and the five-day value is 3.0 mg/L. Thus BOD5 = 8.5 - 3.0 = 5.5 mg/L. Microorganisms used 5.5 mg/L while decomposing organic matter. For comparable samples and conditions, higher BOD generally signals greater organic load.
For a sewage-fed lake: nutrient input -> algal bloom -> dead algae decompose -> microbial oxygen demand rises -> dissolved oxygen falls -> fish stress or death. Biomagnification instead tracks pollutant concentration: 0.01 mg/kg in producers -> 0.1 mg/kg in primary consumers -> 1.0 mg/kg in secondary consumers -> 10.0 mg/kg in a top predator. These illustrative tenfold steps teach direction, not a universal ratio.
How Teaching Exams Turn These Concepts into Questions
Five useful formats are definition contrast, sequence ordering, biome-clue matching, assertion and reason, and a short energy or BOD numerical. Any exam-specific pattern, mark, date or count comes from the conducting body's current notification, for UGC NET the one at ugcnet.nta.nic.in.
Try three mini-checks:
Producers hold 20,000 kJ and the prompt directs 10% transfer. Primary consumers receive 2,000 kJ, then secondary consumers receive 200 kJ.
A site has 1 C, 180 mm precipitation and permafrost. The best fit is tundra.
Nutrient enrichment is followed by algal growth and oxygen decline. This is eutrophication, not biomagnification.
Assertion trap: “Energy and nutrients both cycle” is false. Nutrients cycle; energy flows one way and dissipates as heat. Assertion-and-reason items are subtler: “a food web is more stable than a food chain” is true, but the reason “because it carries more total energy” is false. A web carries no extra energy, only alternative routes, so losing one species need not break the flow.
Concept Traps and a One-Page Revision Grid
Wrong shortcut | Why it fails | Correct rule |
|---|---|---|
Habitat equals niche | Place differs from function | Habitat is where; niche is role |
Chain equals web | A web joins chains | Follow every arrow |
All pyramids are upright | Number and biomass vary | Energy pyramid is upright |
Ozone loss causes warming | Mechanisms differ | Separate ozone loss from heat retention |
Higher BOD means cleaner water | More oxygen was used | Comparable higher BOD suggests more organic load |
Biome is one huge ecosystem | It groups ecosystems | Use climate and vegetation |
For a 60-second routine, identify scale, mark biotic and abiotic parts, follow arrows, choose energy or matter, read temperature and precipitation, then map cause to mechanism to effect. Revise the grid, then attempt a mixed set that mingles vocabulary, energy transfer, biome clues and pollution mechanisms, and record every error under one of those four heads.
Short Version and the Next Study Step
Ecosystems join organisms and physical surroundings. Energy moves through trophic levels and decreases. Nutrients cycle. Biomes reflect broad climate and vegetation patterns. Environmental questions become easier when traced as cause -> mechanism -> effect.
Use the NTA-UGC-NET Paper 1 course for structured learning, then the UGC NET Paper 1 Test Series after revision. Compare current options on the NET category page.
For a final self-check, reproduce 10,000 -> 1,000 -> 100 -> 10 kJ, classify Sites A to C, and calculate 8.5 - 3.0 = 5.5 mg/L without looking back. If any one fails, revise that section before attempting a mixed test.
Keep learning

ICT in Education MCQs: 12 Solved Questions on Digital Learning Tools
Solve 12 ICT in Education MCQs, then use clear explanations and a five-layer model to separate files, tools, platforms and public initiatives.
Updated 3 Oct 20268 min readUGC NET Computer Science

Requirements Elicitation Techniques and Use Case Development: Worked Library Example
Follow a fictional library reservation from interviews and observation through testable requirements, a UML use-case model, UC-07, and acceptance checks.
Updated 28 Sep 20266 min readUGC NET Computer Science

Quality Factors: McCall’s and ISO 9126 Models with a Worked Scoring Example
Build both quality models around one maintainability audit. This guide maps their vocabulary, calculates McCall-style and ISO-style scores, and ends with exam-focused checks.
Updated 25 Sep 20265 min readUGC NET Computer Science

Cohesion and Coupling MCQs: 10 Solved Questions on Functional Independence
Practise 10 solved MCQs on cohesion, coupling, functional independence, module dependencies, and the distinctions that make closely matched options easier to separate.
Updated 24 Sep 20267 min readUGC NET Computer Science