Natural Resources, Energy and Disaster Management for Teaching Exams: Complete Notes with Worked Examples
Connect resource renewability, primary and secondary energy, and disaster risk through clear definitions, exam traps and a fully worked district case.
KnowledgeGate Team
Exam prep & CS education
Updated 27 Aug 20266 min read
A resource can be renewable and still be overused, electricity is often mistaken for a primary energy source, and a hazardous event is sometimes labelled a disaster before anyone checks exposure, vulnerability or capacity. Resource use, energy choices and disaster management are connected: they shape environmental conditions and vulnerability before, during and after damaging events. The central relationship is simple: people draw resources and energy from the environment, patterns of use raise or lower vulnerability, and disaster management acts before, during and after a damaging event.
Put the whole topic on one map before memorising examples
Natural resources answer, “What do people draw from the environment?” Energy resources answer, “How are usable work and services powered?” Disaster management asks how avoidable loss can be reduced when hazards meet exposed and vulnerable communities.
Apply three tests. For a resource, check its origin, renewability, and whether it behaves as a stock or a flow. For energy, separate primary from secondary, then renewable from non-renewable. For disasters, identify hazard, exposure, vulnerability and capacity before naming the management stage. The UGC NET Preparation Courses and Test Series page groups the relevant study routes for resource classification, energy conversion and disaster-risk reduction.
Natural resources: renewable does not mean inexhaustible
A natural resource is a material, organism, environmental condition or energy flow used to support life and human activity.
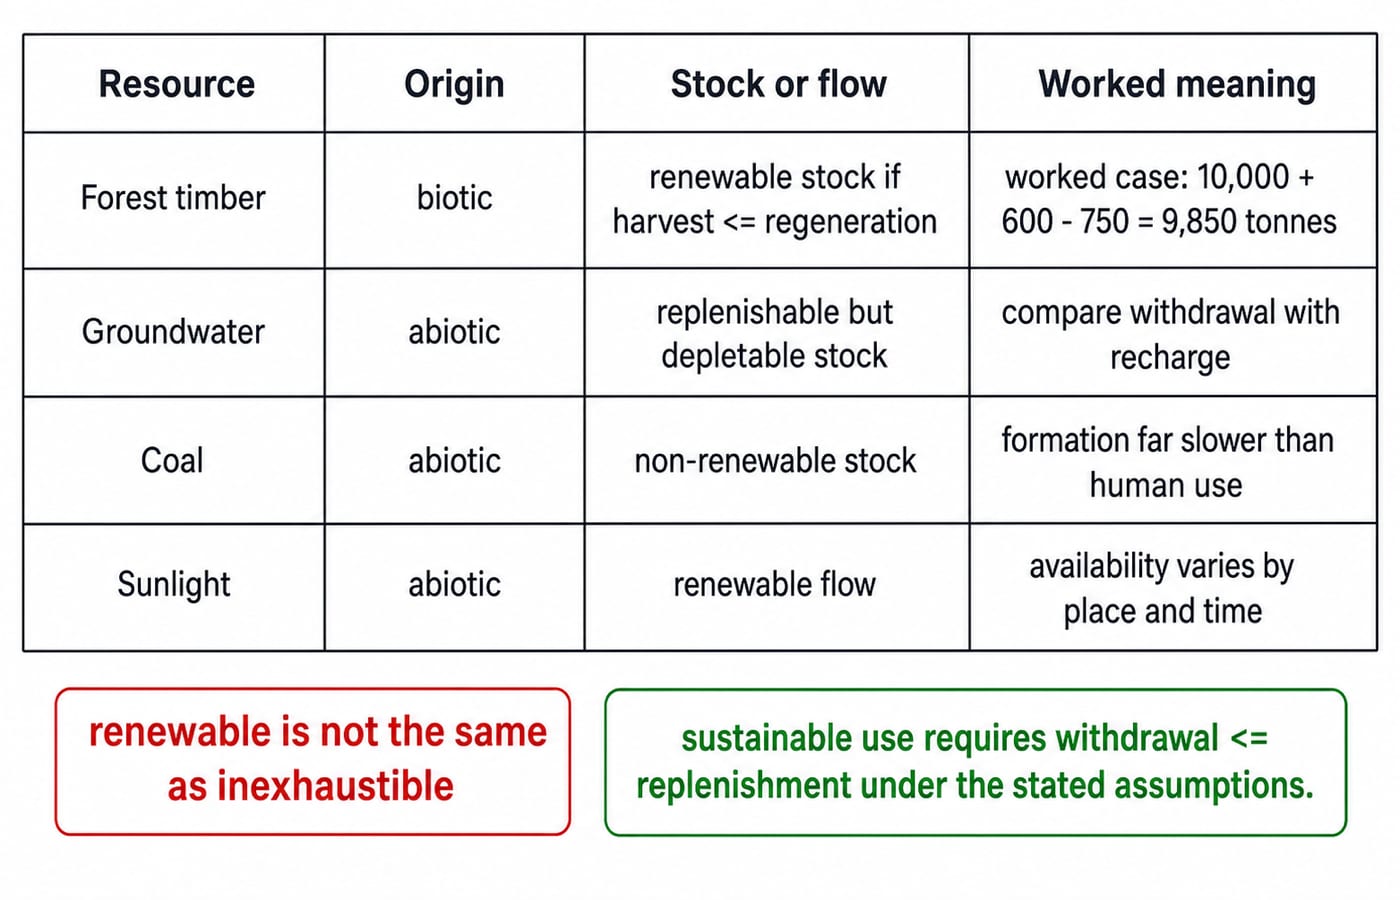
Resource | Origin | Resource behaviour |
|---|---|---|
Forest timber | Biotic | Renewable only when use remains within regeneration |
Groundwater | Abiotic | Replenishable but depletable stock |
Coal | Abiotic | Non-renewable stock |
Sunlight | Abiotic | Renewable flow |
Test forest use with a stock balance. Starting biomass is 10,000 tonnes, regeneration is 600 tonnes/year, and harvest is 750 tonnes/year. Net change is 600 - 750 = -150 tonnes/year, so after one year the stock is 10,000 - 150 = 9,850 tonnes. If harvest falls to 480 tonnes/year, net change becomes 600 - 480 = +120 tonnes/year, giving 10,000 + 120 = 10,120 tonnes, with all other conditions unchanged.
Conservation means planned, efficient use with protection. Preservation restricts use to protect ecological value. Even a positive annual balance does not prove long-term sustainability if soil, water, habitat or community access is being damaged.
Energy resources: separate source, carrier, power and efficiency
Primary energy exists in nature before conversion. Coal, crude oil, sunlight, wind and flowing water are examples. Secondary energy, or an energy carrier, results from conversion. Electricity and refined fuels belong here. Electricity may therefore come from renewable or non-renewable primary sources.
Solar is modular but variable. Wind needs no fuel input but is site-dependent. Hydropower is controllable with storage, but can affect rivers and settlements. Biomass can use residues, yet it can cause pollution or overharvesting. Fossil fuels are energy-dense but finite and emission-intensive. Nuclear power has low operational carbon emissions, but it uses non-renewable fuel and requires demanding safety and waste systems.
Keep the units clean. Power is a rate, measured here in kW; energy is power over time, measured in kWh. If a system receives 1,000 kWh and delivers 800 kWh, efficiency is (800 / 1,000) x 100 = 80%. Efficiency improves the input-output ratio. Conservation can also lower demand through behaviour and operating choices.
Disaster risk: hazard, exposure, vulnerability and capacity
A hazard is a potentially damaging event or process. Exposure means people and assets are in harm's way. Vulnerability is susceptibility to harm, while capacity is the local strength available to anticipate, cope and recover. A disaster is a serious disruption when this interaction overwhelms available capacity. A cyclone over open ocean is a hazard, not automatically a disaster.
Hazard groups are useful but not watertight. Geophysical hazards include earthquakes and landslides. Hydro-meteorological hazards include floods, cyclones, heatwaves and droughts. Epidemics are biological hazards. Industrial leaks and major fires are technological or human-induced hazards. One event can cascade, as when an earthquake damages an industrial facility.
Treat management as a continuous cycle: prevention where feasible; mitigation to reduce likely damage; preparedness through warnings, plans, drills and supplies; response through rescue, relief and immediate protection; and recovery through restoration, reconstruction and livelihood support. Floodplain zoning is mitigation, an evacuation drill is preparedness, boat rescue is response, and safer rebuilding is recovery.
Worked district case: water, solar supply and flood risk
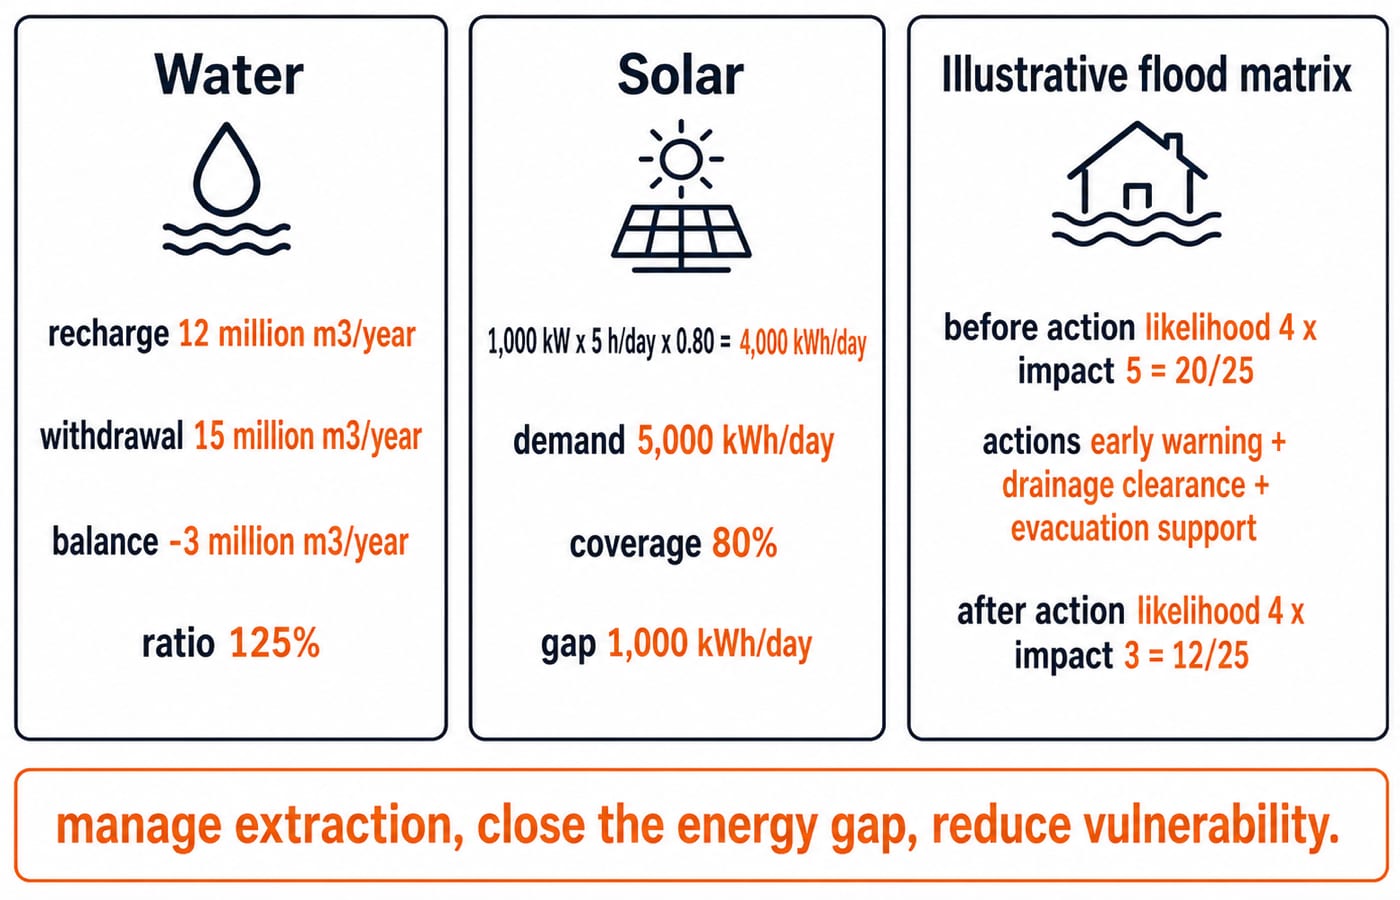
Start with the groundwater balance. Annual groundwater recharge is 12 million m3/year, while withdrawal is 15 million m3/year. The balance is 12 - 15 = -3 million m3/year. The withdrawal-to-recharge ratio is (15 / 12) x 100 = 125%. The district therefore withdraws 3 million m3/year more than the stated annual recharge. The ratio alone does not show aquifer storage or long-term availability.
Next, take a 1,000 kW solar array, 5 equivalent full-sun hours/day and a 0.80 performance factor. Daily output is 1,000 x 5 x 0.80 = 4,000 kWh/day. Against demand of 5,000 kWh/day, coverage is (4,000 / 5,000) x 100 = 80%, leaving 5,000 - 4,000 = 1,000 kWh/day. Actual output varies with solar irradiance, temperature, orientation, shading and system losses.
For flood risk, use a simple five-point matrix. Likelihood 4/5 times impact 5/5 gives 20/25. If early warning, drainage clearance and evacuation support reduce assumed impact from 5 to 3, while likelihood remains 4, the risk score becomes 4 x 3 = 12/25. Mitigation and preparedness reduce consequences in this model. They do not stop the rainfall hazard.
How teaching exams turn these concepts into questions
Five useful practice formats are: classify a resource, match a source to a constraint, distinguish power from energy, sequence disaster-management actions, or use case clues to identify hazard, exposure, vulnerability or capacity.
Use the district case for three quick checks:
What does withdrawal of
15 million m3against recharge of12 million m3show? A deficit of3 million m3/yearunder the stated balance.What is
1,000 kW x 5 h x 0.80? It is4,000 kWh/day.Where does an evacuation drill belong? Preparedness, not response.
The official UGC NET site lists current syllabus and pattern notices. UGC NET Paper 1 vs Paper 2: What Each Tests explains the distinction between the two papers. CTET EVS Pedagogy: 6 Themes and How It Is Tested extends the environmental concepts to CTET pedagogy. For timed topic drills, use the UGC NET Paper 1 Test Series.
Common traps and the exact correction for each
Trap | Correction |
|---|---|
Renewable means inexhaustible | A renewable stock can be depleted faster than it regenerates |
Biomass is automatically clean | Pollution and overharvesting can still occur |
Nuclear fuel is renewable | Low operational emissions do not make its fuel renewable |
Electricity is a primary source | Electricity is an energy carrier |
|
|
Hazard means disaster | Disaster also depends on exposure, vulnerability and capacity |
Exposure means vulnerability | Exposure is presence in harm's way; vulnerability is susceptibility |
Mitigation means response | Mitigation reduces likely loss before impact; response meets immediate needs |
Recovery should reduce vulnerability, not rebuild risk. For every numerical, copy units, write the equation, substitute, compute and check physical sense. Daily energy must be in kWh/day, not kW.
Short version and the next study step
Classify a resource on more than one axis.
Compare use with replenishment.
Separate source, carrier, power and energy.
Distinguish hazard, exposure, vulnerability and capacity.
Place each action in the management cycle.
Show units in every calculation.
The district case results are: water balance -3 million m3/year, withdrawal ratio 125%, solar output 4,000 kWh/day, solar coverage 80%, and flood score reduced from 20/25 to 12/25. Continue with the NTA UGC NET Paper 1 Course for a structured next step.
Keep learning
Function Keys F1-F12 Explained: Uses, Worked Shortcut Map and Exam Traps
Learn what F1 through F12 do in named Windows and Microsoft application contexts, then solve a nine-command classification and avoid common modifier traps.
Updated 20 Oct 20266 min readUGC NET Computer Science
E-Waste Management Explained: Lifecycle, Worked Recovery Example and Exam Traps
Learn how e-waste moves from use to reuse, recycling and controlled residue. A hypothetical 600 kg batch shows how to close the mass balance and avoid denominator traps.
Updated 16 Oct 20266 min readUGC NET Computer Science
Data Protection, IPR and Open Source Explained: Two Worked Cases and Exam Traps
Separate privacy from security, match IP rights to software assets, and solve two numerical cases on data minimisation and mixed-licence releases.
Updated 12 Oct 20266 min readUGC NET Computer Science
Common Software & Tools MCQs: 12 Solved ICT Questions Explained
Attempt 12 previous-year ICT MCQs before reading concise explanations that separate applications, hardware, web tools, abbreviations, malware and operating systems.
8 Oct 20267 min readUGC NET Computer Science