Water Pollution for Teaching Exams: Notes, BOD Example and MCQ Traps
Connect every water-pollution source to its pollutant, indicator, effect and control: BOD5 worked at 40 and 10 mg/L, treatment reaching 88.75% overall removal, and the MCQ traps exams reuse.
KnowledgeGate Team
Exam prep & CS education
Updated 20 Aug 20266 min read

Water pollution looks like a list of terms until a question mixes sources, indicators, effects and treatment. Every term below sits on one chain: source -> pollutant -> measurable indicator -> effect -> control. Learn the chain and the terms stop competing for the same slot in your memory.
Water pollution: definition and an exam-ready framework
Water pollution is an undesirable physical, chemical or biological change that makes water harmful or less suitable for organisms or intended uses. Contamination is the presence of an unwanted agent. Pollution connects contamination or another change with adverse quality or use impacts, so the terms are not interchangeable in every technical context.
Use a five-part recall frame: source, pollutant, measurable indicator, consequence, control. Untreated sewage, for example, introduces biodegradable matter and microbes. BOD, DO and microbial indicators reveal oxygen stress and disease risk; treatment and safe disposal provide control.
This topic sits in the People, Development and Environment unit of UGC NET Paper 1, and the UGC NET preparation category collects that Paper 1 material. CTET and state TET environmental studies papers ask the same science at school level, so the chains below hold either way and only the depth of the calculation changes.
Sources and pollutant types
A point source has an identifiable outlet, such as a named pipe. A diffuse or non-point source is spread across an area, such as runoff from many farms. This tells you where an input comes from. Domestic sewage, industrial effluent, nutrients, pesticides, oil, plastics, pathogens, sediment and heated discharge tell you what enters or changes the water.
Source | Main input | Best clue in a question | Likely effect |
|---|---|---|---|
Domestic sewage | Biodegradable organic matter and pathogens | High BOD or faecal contamination | Oxygen depletion or disease risk |
Fertiliser runoff | Nitrates and phosphates | Nutrient enrichment | Eutrophication |
Persistent pollutant release | Slowly degraded contaminant | Rising concentration along a food chain | Biomagnification |
Heated discharge | Hot water | Temperature change near an outlet | Lower oxygen availability and thermal stress |
Source and pollutant answer different questions. One pipe may carry several pollutants; one nutrient may arrive from many diffuse sources.
Water-quality indicators and a worked BOD calculation
Keep these indicators separate:
DO is dissolved oxygen available in water.
BOD estimates oxygen used by microorganisms decomposing biodegradable matter under specified test conditions.
COD estimates the oxygen equivalent for chemical oxidation.
pH indicates acidity or alkalinity.
Turbidity indicates cloudiness, while TDS tracks dissolved material.
High organic load often raises BOD and can lower DO. BOD is not another name for dissolved oxygen.
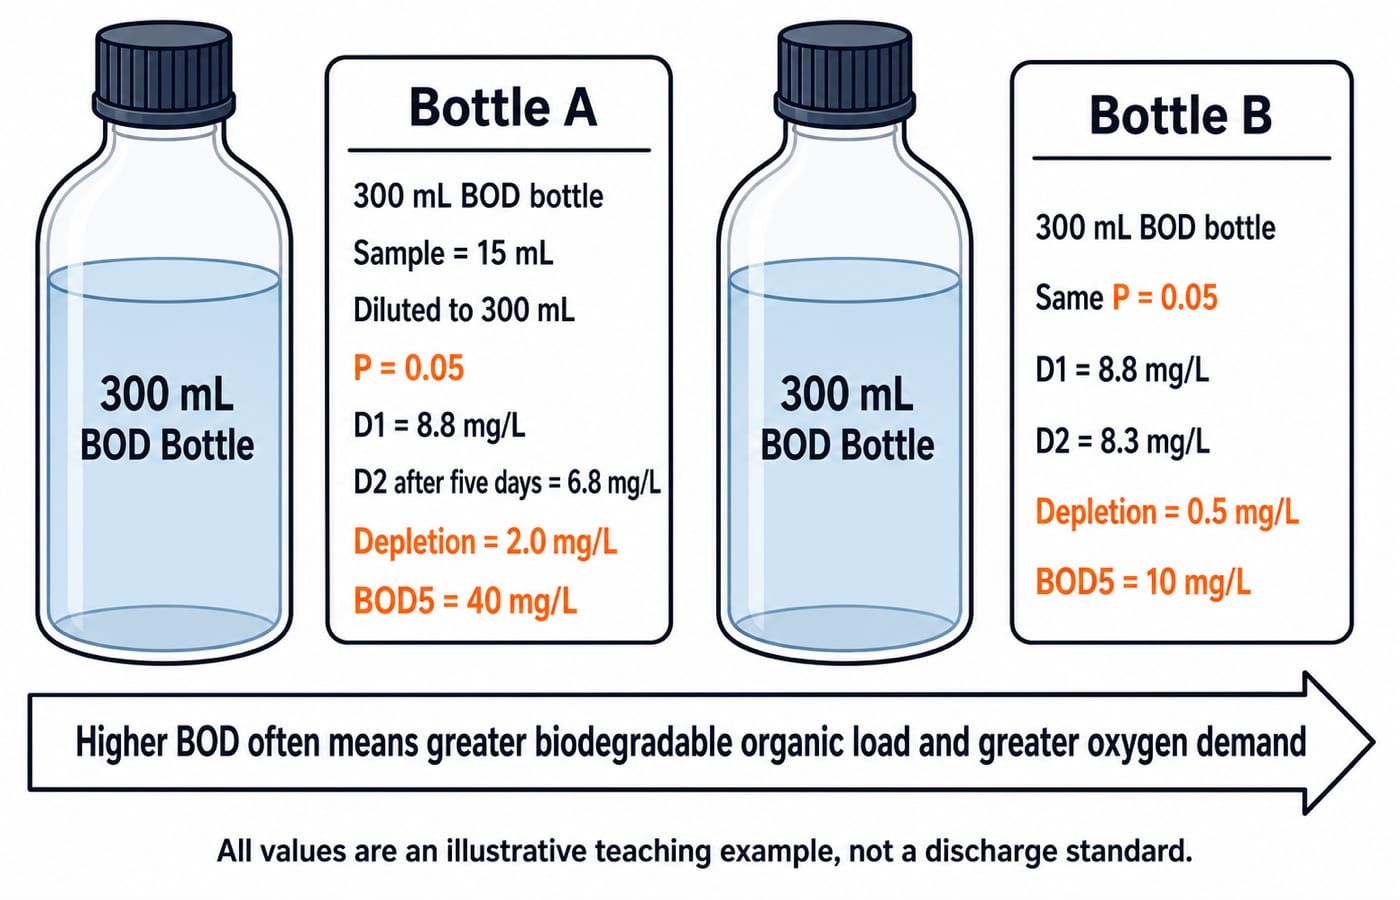
Bottle A holds 15 mL of wastewater diluted to 300 mL in an unseeded test:
Sample fraction:
P = 15/300 = 0.05.Initial DO,
D1 = 8.8 mg/L; five-day DO,D2 = 6.8 mg/L.DO depletion:
D1 - D2 = 8.8 - 6.8 = 2.0 mg/L.BOD5 = (D1 - D2)/P = 2.0/0.05 = 40 mg/L.
Bottle B is diluted identically, but its DO falls only from 8.8 to 8.3 mg/L, so depletion is 0.5 mg/L and BOD5 = 0.5/0.05 = 10 mg/L. Bottle A therefore carries four times the biodegradable oxygen demand. A standard laboratory BOD5 runs five days at 20 degrees Celsius and adds a seed correction where the sample carries too few of its own microorganisms; the arithmetic above is the simplified unseeded case.
Eutrophication and biomagnification
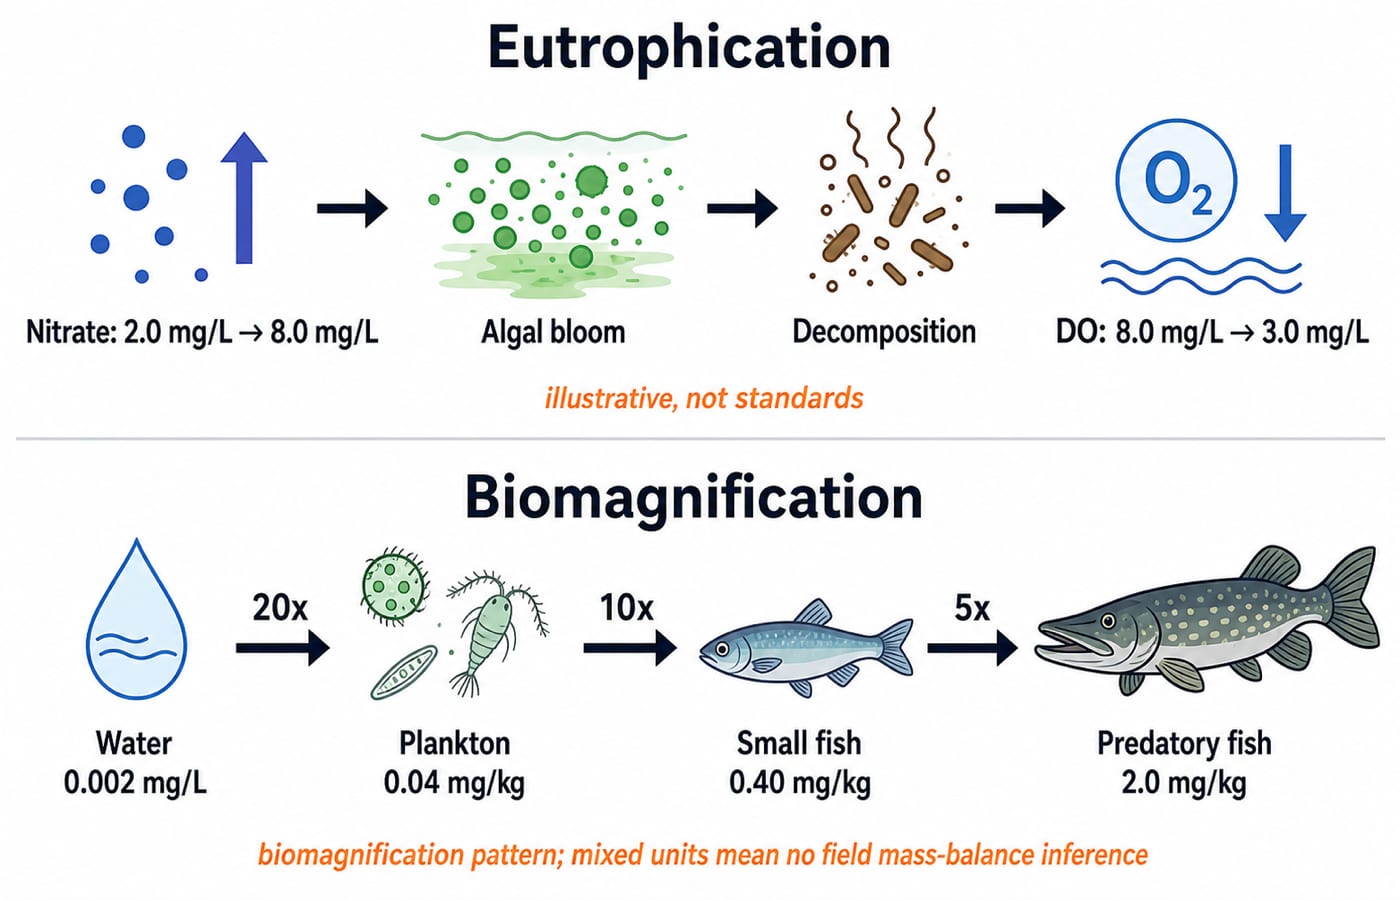
Eutrophication is a nutrient-driven chain: excess nitrate or phosphate -> rapid algal or plant growth -> death and decomposition -> greater microbial oxygen demand -> lower DO -> stress or death of oxygen-dependent organisms. Algae are not simply “the pollution”. Nutrient input starts the chain; oxygen depletion comes later.
Bioaccumulation is build-up within one organism over time. Biomagnification is an increase across trophic levels. An illustrative persistent-pollutant pattern is water 0.002 mg/L -> plankton 0.04 mg/kg -> small fish 0.40 mg/kg -> predatory fish 2.0 mg/kg.
Step factors are 0.04/0.002 = 20x, 0.40/0.04 = 10x and 2.0/0.40 = 5x; the numerical end-to-start ratio is 2.0/0.002 = 1,000. Mixed water and organism units make this a pattern, not a field mass-balance calculation.
The common trap is to connect biodegradable organic waste first with BOD and oxygen depletion, but persistent pollutants with biomagnification. Not every pollutant biomagnifies.
Health and ecological effects
Questions often mix exposure routes, so separate them. Cholera, typhoid and hepatitis A follow ingestion of contaminated water or food. Skin contact while bathing or wading is a second route and does not depend on drinking anything. Eating fish from a contaminated water body is a third, because aquatic food chains carry biomagnifying contaminants up to the fish a person actually eats. A stem that says the person drank the water and a stem that says the person ate fish from the lake are testing different mechanisms.
Ecological outcomes include oxygen depletion, fish stress or mortality, altered species composition, habitat degradation and loss of safe uses. Effects vary with pollutant, concentration, exposure and receiving water, so “all polluted water kills fish” is too absolute.
Question clue | Best match |
|---|---|
High BOD | High biodegradable oxygen demand |
Nutrient enrichment | Eutrophication |
Persistent pollutant across a food chain | Biomagnification |
Faecal contamination | Microbial indicator testing |
Heated effluent | Thermal pollution |
Treatment and prevention
A broad treatment sequence is screening and grit removal, primary physical settling, secondary biological treatment, advanced polishing where required, then disinfection for the relevant reuse or discharge route. The exact train depends on influent quality and required output.
Suppose influent BOD is 240 mg/L and primary treatment lowers it to 180 mg/L:
Primary removal:
(240 - 180)/240 x 100 = 60/240 x 100 = 25%.Secondary treatment lowers the remaining 180 mg/L to 27 mg/L. Stage removal:
(180 - 27)/180 x 100 = 153/180 x 100 = 85%.Overall removal:
(240 - 27)/240 x 100 = 213/240 x 100 = 88.75%.
Stage percentages act on the remaining load, so they cannot be added: 25% and 85% do not make 110%, and the correct overall figure is 88.75%. Prevention comes before the pipe. Source reduction, safe sanitation, nutrient management on farms, spill containment and segregated industrial streams all cut the load a works has to remove, which is why a control question usually rewards the upstream option over a bigger treatment plant.
How teaching exams frame questions and MCQ traps
Expect source-pollutant matching, high-BOD and low-DO relationships, treatment sequencing, eutrophication ordering, bioaccumulation versus biomagnification, or a one-line BOD calculation.
Assertion: A rise in biodegradable organic matter can lower DO. Reason: Microbial decomposition consumes oxygen. Both are true and the reason explains the assertion. Read the option list before picking a letter, because the wording that means both true with the reason explaining the assertion sits at A in some papers and at B in others, while the logic you just applied does not move.
Correct these common traps:
BOD is not DO.
Clear water is not automatically safe, and contamination is not always visible.
Eutrophication is not biomagnification.
A point source does not mean a single chemical.
Primary treatment is not the complete treatment train.
For pedagogy framing, read CTET EVS Pedagogy: 6 Themes and How It Is Tested. For the wider picture this topic sits inside, read Ecosystem, Biomes and Environmental Issues for Teaching Exams. Check the current official bulletin for a specific exam before relying on marks, dates, counts or negative-marking rules.
The 60-second revision card and next practice step
Recall chain | Meaning |
|---|---|
Sewage -> BOD rises -> DO may fall | Biodegradable load increases oxygen demand |
Nutrients -> eutrophication | Enrichment begins the algal-growth and decomposition chain |
Persistent pollutant -> biomagnification | Concentration pattern rises across trophic levels |
Cloudiness -> turbidity | Suspended particles scatter light; turbidity says nothing about dissolved content |
Dissolved material -> TDS | TDS tracks dissolved salts and minerals, not suspended particles |
Screening -> settling -> biological -> polishing -> disinfection | Physical first, biological next, disinfection last and never first |
Without looking, reproduce Bottle A's 40 mg/L BOD5 and the treatment example's 88.75% overall removal. Then distinguish eutrophication from biomagnification in one sentence.
Use the NTA UGC NET Paper 1 Course to rebuild weak concepts, then use the UGC NET Paper 1 Test Series to test retrieval and trap recognition.
Keep learning

ICT in Education MCQs: 12 Solved Questions on Digital Learning Tools
Solve 12 ICT in Education MCQs, then use clear explanations and a five-layer model to separate files, tools, platforms and public initiatives.
Updated 3 Oct 20268 min readUGC NET Computer Science

Requirements Elicitation Techniques and Use Case Development: Worked Library Example
Follow a fictional library reservation from interviews and observation through testable requirements, a UML use-case model, UC-07, and acceptance checks.
Updated 28 Sep 20266 min readUGC NET Computer Science

Quality Factors: McCall’s and ISO 9126 Models with a Worked Scoring Example
Build both quality models around one maintainability audit. This guide maps their vocabulary, calculates McCall-style and ISO-style scores, and ends with exam-focused checks.
Updated 25 Sep 20265 min readUGC NET Computer Science

Cohesion and Coupling MCQs: 10 Solved Questions on Functional Independence
Practise 10 solved MCQs on cohesion, coupling, functional independence, module dependencies, and the distinctions that make closely matched options easier to separate.
Updated 24 Sep 20267 min readUGC NET Computer Science