Read the following pie charts carefully and answer the questions given below.…
2025
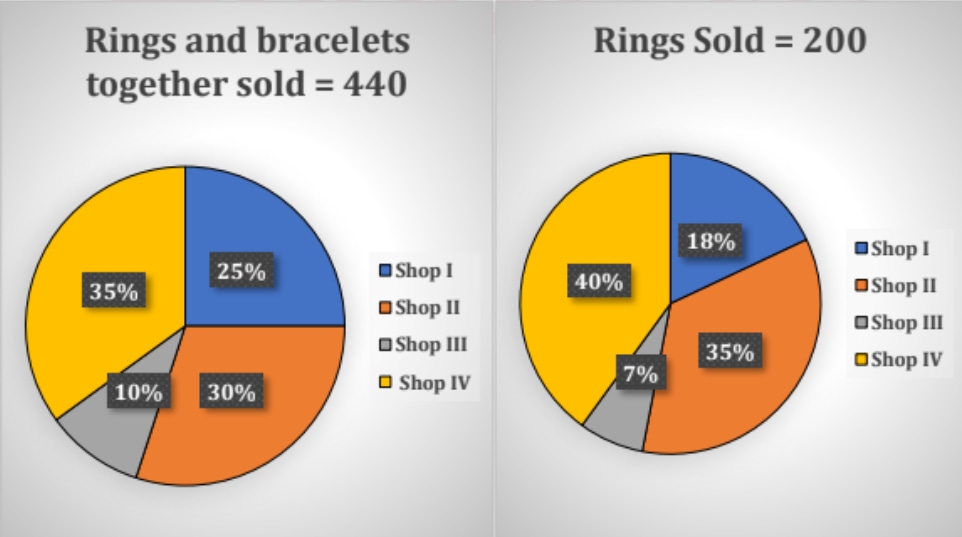
Read the following pie charts carefully and answer the questions given below. The pie chart I shows the percentage distribution of the total number of rings and bracelets together sold by four shops. The pie chart II shows the percentage distribution of the total number of rings sold by four shops.
The price of each ring and each bracelet sold by shop III is Rs 275 and X+180, respectively. If the total amount received by shop III to sell all the rings and bracelets is Rs 10150, then find the value of X.
Answer: E. 30 — ConceptWhen one pie chart gives the combined total of two related item-types for each entity, and a second pie chart gives just one of those item-types' total…
- A.
20
- B.
25
- C.
40
- D.
35
- E.
30
Attempted by 7 students.
Show answer & explanation
Correct answer: E
Concept
When one pie chart gives the combined total of two related item-types for each entity, and a second pie chart gives just one of those item-types' total for the same entities, the missing item-type's count for any single entity equals (that entity's percentage share of the combined total) minus (that entity's percentage share of the single-item-type total). Once both quantities for an entity are known, a revenue equation of price × quantity summed across item-types can be solved for an unknown price variable.
Application
From Pie Chart I, Shop III holds a 10% share of the combined rings-and-bracelets total of 440, so Shop III sold 44 rings and bracelets in all.
From Pie Chart II, Shop III holds a 7% share of the rings total of 200, so Shop III sold 14 rings.
Bracelets sold by Shop III = 44 − 14 = 30.
Revenue equation for Shop III: Rs 275 × 14 + (X + 180) × 30 = Rs 10150.
Simplifying: 3850 + 30X + 5400 = 10150, so 9250 + 30X = 10150, so 30X = 900, so X = 30.
Cross-check
Putting X = 30 back gives a bracelet price of Rs 210. Revenue = 275 × 14 + 210 × 30 = 3850 + 6300 = Rs 10150, which matches the amount given in the question, confirming X = 30.