Study the charts given below carefully and answer the following questions. Pie…
2021
Study the charts given below carefully and answer the following questions.
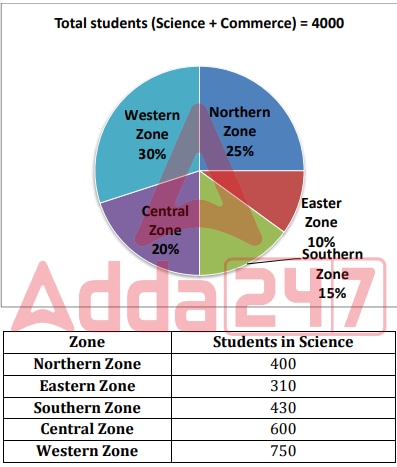
Pie chart shows the percentage distribution of total students (Science +Commerce) in 12th class of five different Zones and table shows the number of students in same class in science of same zones.
Number of students of commerce stream in Northern Zone are what percent more or less than number of total students in Southern Zone.
Answer: B. 0% — ConceptFor each zone, Total students = Science students + Commerce students. The pie chart gives each zone's share of the grand total (4000), so a zone's…
- A.
20%
- B.
0%
- C.
5%
- D.
10%
- E.
12.5%
Attempted by 1 students.
Show answer & explanation
Correct answer: B
Concept
For each zone, Total students = Science students + Commerce students. The pie chart gives each zone's share of the grand total (4000), so a zone's Total = (its pie %) x 4000. A zone's Commerce count is then that Total minus its Science count from the table. To compare two quantities A and B as "percent more or less", use (A - B) / B x 100.
Reading the data
Grand total (Science + Commerce) = 4000.
Northern Zone share = 25%, so Northern total = 0.25 x 4000 = 1000.
Southern Zone share = 15%, so Southern total = 0.15 x 4000 = 600.
Science students in Northern Zone (table) = 400.
Application
Northern Commerce = Northern total - Northern Science = 1000 - 400 = 600.
Southern total = 600.
Required comparison: Northern Commerce vs Southern total = (600 - 600) / 600 x 100.
= 0 / 600 x 100 = 0%.
Cross-check
Northern Commerce (600) and Southern total (600) are equal, so neither is more nor less than the other. The result is exactly 0%, confirming the comparison.