Directions : Read the following pie charts carefully and answer the questions…
2025
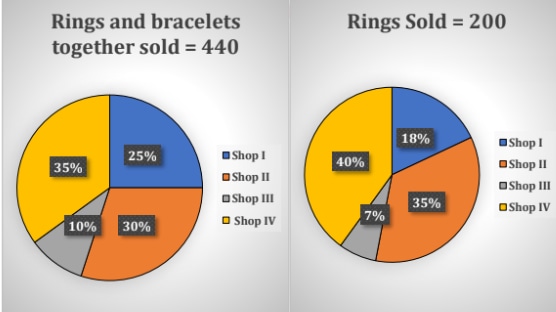
Directions : Read the following pie charts carefully and answer the questions given below. The pie chart I shows the percentage distribution of the total number of rings and bracelets together sold by four shops. The pie chart II shows the percentage distribution of the total number of rings sold by four shops.
Find the ratio between the average number of bracelets sold by shops I and III and the difference between the number of rings sold by shops II and IV.
Answer: D. 26:5 — For any shop, the number of bracelets sold equals the total items (rings and bracelets together) sold by that shop minus the number of rings sold by that…
- A.
23:5
- B.
22:7
- C.
21:4
- D.
26:5
- E.
24:1
Attempted by 12 students.
Show answer & explanation
Correct answer: D
For any shop, the number of bracelets sold equals the total items (rings and bracelets together) sold by that shop minus the number of rings sold by that shop, since both pie charts describe the same four shops. Combining two computed figures into a ratio requires first finding each figure separately — here, an average of two shops’ bracelet counts, and a difference of two shops’ ring counts — before comparing them.
Converting each shop’s percentage share to actual counts using the two chart totals (440 rings and bracelets together, 200 rings) gives:
Shop | Together (Chart I) | Rings (Chart II) | Bracelets (Together − Rings) |
|---|---|---|---|
I | 110 | 36 | 74 |
II | 132 | 70 | 62 |
III | 44 | 14 | 30 |
IV | 154 | 80 | 74 |
Average number of bracelets sold by Shops I and III = (74 + 30) ÷ 2 = 52.
Difference between the number of rings sold by Shops II and IV = 80 − 70 = 10.
Required ratio = 52 : 10, which simplifies (dividing both terms by their HCF, 2) to 26 : 5.
As an independent check, the Chart I percentages (25 + 30 + 10 + 35 = 100%) account for all 440 items and the Chart II percentages (18 + 35 + 7 + 40 = 100%) account for all 200 rings, confirming each shop’s converted counts; re-dividing 52 and 10 by their common factor 2 independently reproduces 26 : 5, matching the ratio derived above.