The bar graph below shows the output of five carpenters over one month, each…
GATE · 2017 · CE · Set 1 · General Aptitude
The bar graph below shows the output of five carpenters over one month, each of whom made different items of furniture: chairs, tables, and beds.
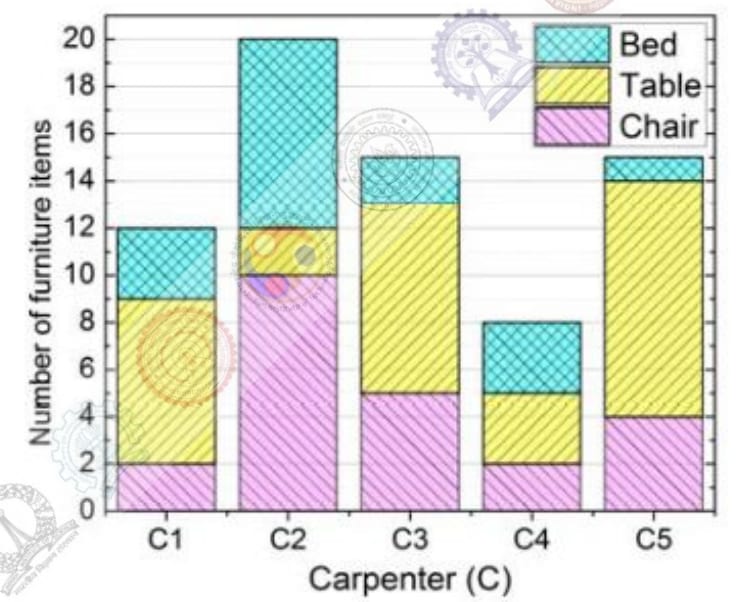
Consider the following statements.
i. The number of beds made by carpenter C2 is exactly the same as the number of tables made by carpenter C3.
ii. The total number of chairs made by all carpenters is less than the total number of tables.
Which one of the following is true?
- A.
Only i
- B.
Only ii
- C.
Both i and ii
- D.
Neither i nor ii
Attempted by 1 students.
Sign up free to check your answer
Sign up freeLoading lesson…