The chart given below compares the Installed Capacity (MW) of four power…
GATE · 2024 · BM · General AptitudeGATE · 2024 · CE · Set 1 · General AptitudeGATE · 2024 · CH · General AptitudeGATE · 2024 · EY · General AptitudeGATE · 2024 · GG · General AptitudeGATE · 2024 · XH · General Aptitude
The chart given below compares the Installed Capacity (MW) of four power generation technologies, T1, T2, T3, and T4, and their Electricity Generation (MWh) in a time of 1000 hours (h).
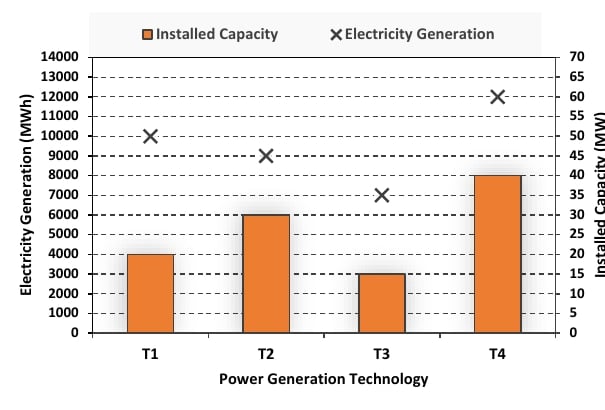
The Capacity Factor of a power generation technology is:
Which one of the given technologies has the highest Capacity Factor?
- A.
T1
- B.
T2
- C.
T3
- D.
T4
Attempted by 6 students.
Sign up free to check your answer
Sign up freeLoading lesson…