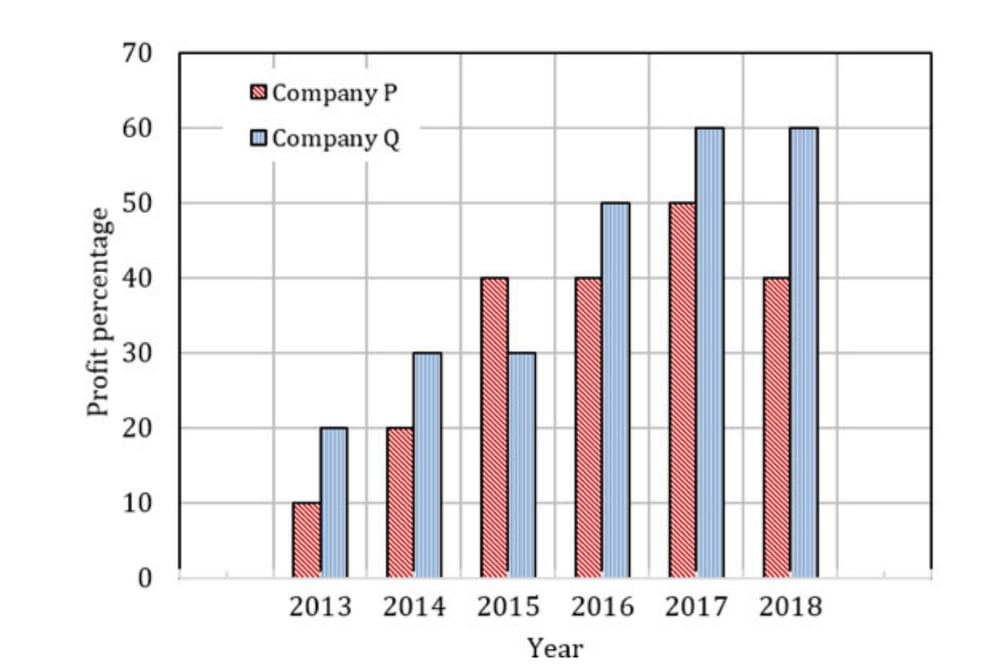
The profit shares of two companies P and Q are shown in the figure. If the two…
GATE · 2020 · XE · General Aptitude
The profit shares of two companies P and Q are shown in the figure. If the two companies have invested a fixed and equal amount every year, then the ratio of the total revenue of company P to the total revenue of company Q, during 2013 - 2018 is ____.
- A.
15 : 17
- B.
16 : 17
- C.
17 : 15
- D.
17 : 16
Sign up free to check your answer
Sign up freeLoading lesson…