

Statistics for Competitive Exams: Concepts, Shortcuts and Solved Examples
Learn how to choose the right statistic, turn data into a useful table, calculate efficiently, and catch errors through solved examples and sanity checks.
KnowledgeGate Team
Exam prep & CS education
Updated 6 Nov 20266 min read
Statistics questions become manageable when you match the wording to mean, median, mode, frequency weighting or spread. Use compact tables, safe shortcuts and checks to keep each calculation auditable.
Statistics concepts: identify the data and the quantity being asked
An observation is a recorded value, a variable is what is measured, and a data set collects observations. A frequency is how often a value or class occurs.
Representation determines the route:
Raw data lists every observation, such as
8, 10, 12, 14, 16.A discrete frequency table lists values such as
10, 20, 30, 40, 50with counts.Grouped continuous data places observations into class intervals.
Mean, median and mode describe centre. Range, mean deviation, variance and standard deviation describe spread. Two sets can have the same centre but different consistency.
Use the mean when every value should count, the median when order or an extreme value matters, and the mode when the most frequent value is the target. Explore the broader path through Placement Preparation and Coding: Exams, Eligibility and Courses.
Arithmetic mean shortcuts: totals, corrections and missing values
For raw data:
mean = sum of observations / number of observations
For a frequency table:
mean = sum(fx) / sum(f)
The speed principle is total = mean x count. Corrections, replacements, missing values and combined groups begin there.
Suppose the reported mean of 8 scores is 24. The reported total is:
8 x 24 = 192
A score of 31 was entered instead of 13:
corrected total = 192 - 31 + 13 = 174
corrected mean = 174 / 8 = 21.75
The total was too large by 31 - 13 = 18. The quicker route is 24 - (18 / 8) = 24 - 2.25 = 21.75.
If 6 observations have mean 18, their total is 6 x 18 = 108. Five known observations are 12, 15, 17, 19, 21:
12 + 15 + 17 + 19 + 21 = 84
Therefore, the missing observation is 108 - 84 = 24. Check it by returning to the definition: (84 + 24) / 6 = 108 / 6 = 18.
Mean, median and mode: solve one frequency table three ways
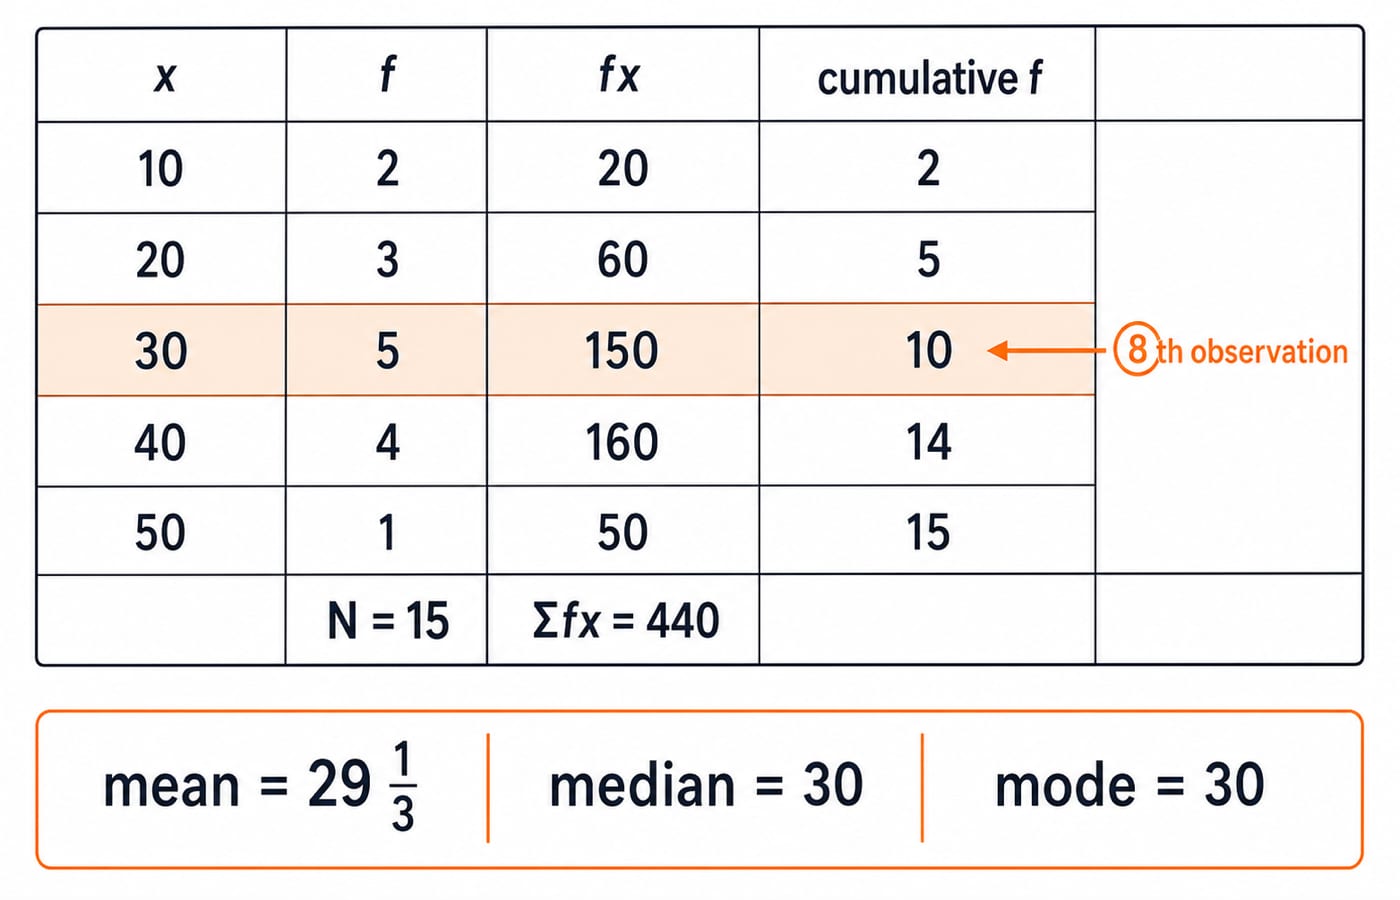
x | f | fx | Cumulative f |
|---|---|---|---|
10 | 2 | 20 | 2 |
20 | 3 | 60 | 5 |
30 | 5 | 150 | 10 |
40 | 4 | 160 | 14 |
50 | 1 | 50 | 15 |
Total | 15 | 440 |
Here, N = sum(f) = 15 and sum(fx) = 440:
mean = 440 / 15 = 29 1/3
The median position is (15 + 1) / 2 = 8th. Cumulative frequency first reaches the 8th observation in the x = 30 row, so the median is 30. The greatest frequency is 5 at x = 30, so the mode is also 30.
Sort raw data before finding its middle observation. In a frequency table, cumulative frequency reveals the position.
Range, variance and standard deviation: measure spread efficiently
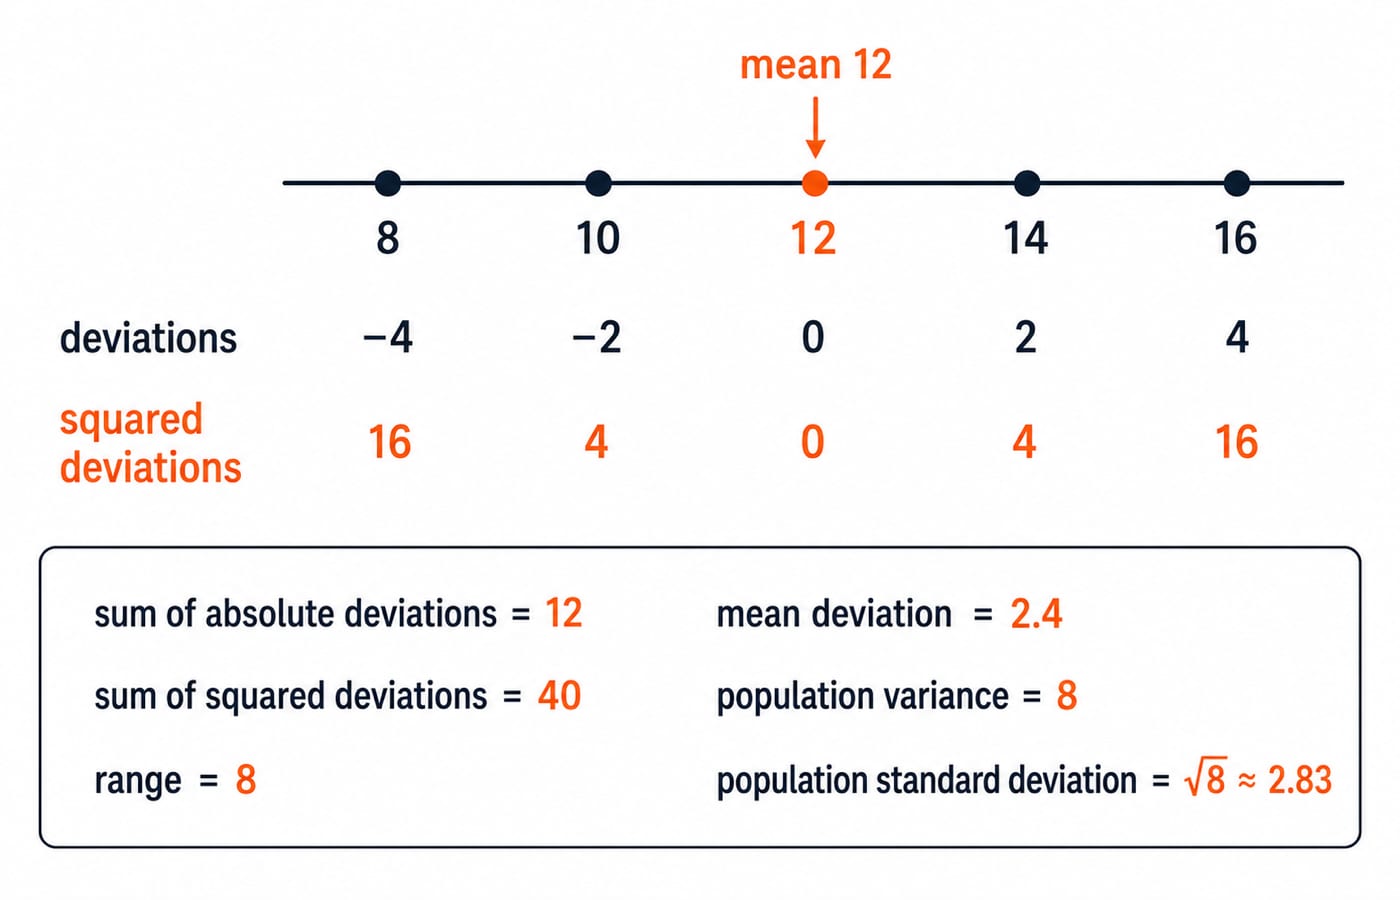
For 8, 10, 12, 14, 16, the mean is 12. The deviations from 12 are -4, -2, 0, 2, 4. Their absolute values sum to 12, while their squares are 16, 4, 0, 4, 16, with sum 40.
Range:
16 - 8 = 8Mean deviation about the mean:
12 / 5 = 2.4Population variance:
40 / 5 = 8Population standard deviation:
sqrt(8), approximately2.83
The computational shortcut gives sum(x^2) = 64 + 100 + 144 + 196 + 256 = 760, so:
variance = 760 / 5 - 12^2 = 152 - 144 = 8
For sample variance, divide by n - 1: 40 / 4 = 10. Switch denominators only when asked.
The set 10, 11, 12, 13, 14 also has mean 12, but squared deviations total 4 + 1 + 0 + 1 + 4 = 10. Its population variance is 10 / 5 = 2, and standard deviation is sqrt(2), approximately 1.41. Equal means do not imply equal consistency.
Combined mean and data transformations: use weights first
Group A has 20 candidates with mean 60, so its total is 20 x 60 = 1200. Group B has 30 candidates with mean 70, giving 30 x 70 = 2100. Thus:
(1200 + 2100) / (20 + 30) = 3300 / 50 = 66
It is not (60 + 70) / 2 = 65. In general:
combined mean = sum(group count x group mean) / total count
The answer 66 lies closer to 70 because Group B is larger, a useful reasonableness check.
Adding 5 to 8, 10, 12, 14, 16 gives 13, 15, 17, 19, 21. The mean rises from 12 to 17, while variance stays 8 and standard deviation stays about 2.83. A constant shifts the centre, not the spread.
Multiplying the values by 2 gives 16, 20, 24, 28, 32. Mean becomes 24, variance becomes 2^2 x 8 = 32, and standard deviation becomes 2 x sqrt(8), approximately 5.66.
Median, mode and empirical shortcuts: recognise approximation
For 10, 11, 12, 13, 54, the mean is 100 / 5 = 20 and the median is 12. The value 54 pulls the mean upward, so the median better represents this set's central ordered value. Median is not universally better.
For a moderately skewed distribution, mode approximately = 3 x median - 2 x mean is an empirical relation, not an identity. With mean 26 and median 28:
estimated mode = 3 x 28 - 2 x 26 = 84 - 52 = 32
Make four rapid checks:
A mean calculated with positive frequencies must lie between the smallest and largest values.
Variance and standard deviation cannot be negative.
A raw-data median requires sorting.
A claimed mode must correspond to the greatest frequency.
If one fails, repair the setup before recalculating.
Statistics question shapes and the traps that cost marks
Question families include direct centre calculations, corrected or missing observations, frequency tables, combined averages, spread comparisons, outlier-based choices, and data-interpretation tables.
The common errors have direct fixes:
Do not average group means without using group sizes as weights.
Use
sum(fx) / sum(f), notsum(x) / sum(f), for a frequency-table mean.Sort raw data before finding its median.
Use cumulative frequency, not ordinary frequency, to locate a median position.
Finish the variance calculation before taking a square root.
Read whether the question asks for a population or sample denominator.
Keep exact intermediate values and round only the final result.
For the wider map, use Aptitude for Placements: Section Topics and Weekly Plan. Banking aspirants can use Bank PO Quant: High-Yield Topics First. Check your exam's current official notification for dates, marks, duration or negative marking.
Statistics short version: choose, calculate, verify
Identify raw, frequency or grouped data. Decide whether the question asks for centre or spread. Build x, f, fx and cumulative-frequency columns only when needed. Calculate from totals, then check the data range and units.
Practise 5 centre questions, 5 correction or combined-mean questions, and 5 spread questions. Label each miss as formula choice, table setup, arithmetic or interpretation.
For a structured placement route through aptitude, reasoning and verbal ability, continue with Aptitude for Placement. Choose the measure, calculate, then verify.
Keep learning
Data Sufficiency: A 5-Step Method, Shortcuts and Solved Examples
Learn to test each statement independently, prove insufficiency with two valid cases, and stop as soon as the target becomes unique. Three worked problems make the method concrete.
Updated 15 Nov 20266 min readAptitude & Reasoning
Data Arrangement Questions: Concepts, Shortcuts and Solved Examples
Turn names, cities, roles and scores into a clean grid. This guide shows safe shortcuts and solves one complete arrangement from clues to answer.
Updated 11 Nov 20266 min readAptitude & Reasoning
Coding-Decoding Concepts and Shortcuts with Solved Examples
Identify, validate and reverse coding-decoding rules through letter shifts, rearrangements, number codes and sentence substitution.
Updated 9 Nov 20265 min readAptitude & Reasoning
Trigonometry for Competitive Exams: Concepts, Shortcuts and Solved Examples
Build trigonometry from one right triangle, recover standard values safely, and solve identities, equations, and height-and-distance problems step by step.
Updated 8 Nov 20266 min readAptitude & Reasoning