

React Performance Optimization Tutorial: Profiler, memo, useMemo, and useCallback Examples
Build one React lab, measure its render and calculation counts, then remove avoidable work while keeping typing responsive.
KnowledgeGate Team
Exam prep & CS education
Updated 14 Nov 20266 min read

A React screen can be logically correct and still feel slow. A parent update may repeat an expensive calculation, recreate props, or ask the browser to handle too many rows. Measure one deterministic 20,000-record example, count its work, apply one optimization at a time, and use practical rules for memo, useMemo, useCallback, state placement, and useDeferredValue.
React performance starts with identifying the work
Separate four costs: a component function runs, derived data is recalculated, React commits changed output, and the browser lays out or paints DOM. A re-render is not automatically a defect. Target unnecessary expensive work or a visibly slow interaction.
The official React Developer Tools guide covers inspecting props and state in Components. Profiler identifies rendering work, while <Profiler id="Results" onRender={...}> records a tree programmatically. Profiling adds overhead, and ordinary production builds do not enable production profiling by default.
const recordCommit = (id, phase, actualDuration, baseDuration) => {
  console.table({ id, phase, actualDuration, baseDuration });
};

<Profiler id="Results" onRender={recordCommit}>
  <ResultsList
    labs={labs}
    query={query}
    mode="compact"
    onComplete={handleComplete}
  />
</Profiler>
Run the same interaction before and after each change. A theme-only commit containing Results confirms that the child joined that commit; after memo and stable props, it should be absent. Compare commit membership and local calculation counts. Durations vary by device and build.
Reproduce one slow interaction, record its component path and calculation counter, change one cause, then repeat. For the browser foundations beneath React, revise Web Technologies for Teaching Exams: HTML and HTTP.
Build and measure the 20,000-record baseline
Create the data once outside the component:
function buildLabs() {
  const names = [
    "React Profiler Lab", "React Hooks Lab", "Redux Toolkit Lab",
    "JavaScript Arrays Lab", "HTML Forms Lab"
  ];
  return Array.from({ length: 20_000 }, (_, i) => ({
    id: i + 1,
    name: names[i % 5],
    score: 20_000 - i
  }));
}

const labs = buildLabs();
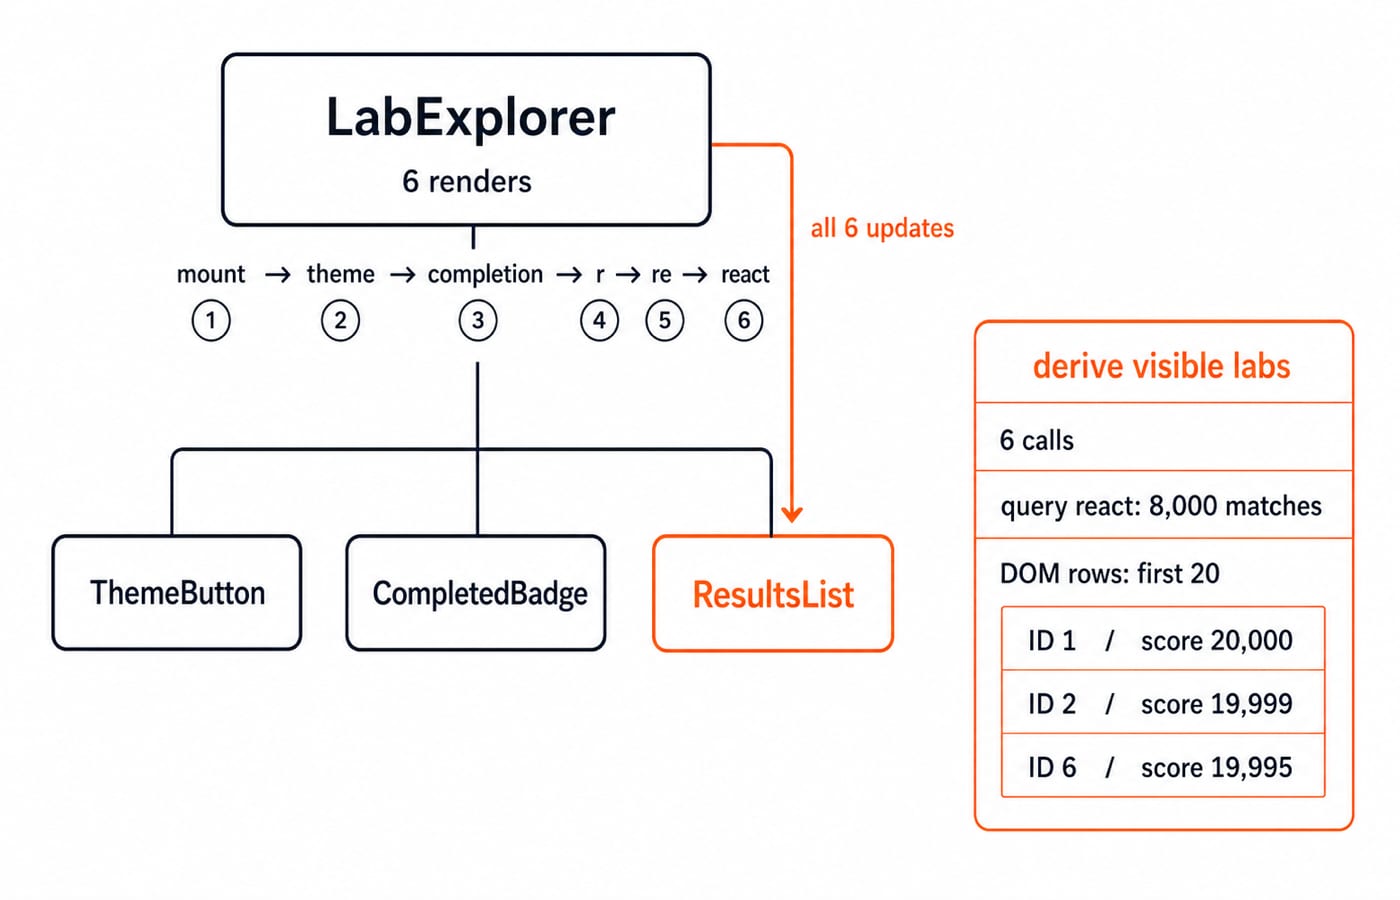
LabExplorer owns query = "", theme = "light", and completedCount = 0. ResultsList lowercases the query, filters with name.includes(query), sorts by descending score, reports matches, and renders visible.slice(0, 20).
For react, two names in each five-record cycle match: 20,000 x 2 / 5 = 8,000. The sorted first rows are:
ID | Name | Score |
|---|---|---|
1 | React Profiler Lab | 20,000 |
2 | React Hooks Lab | 19,999 |
6 | React Profiler Lab | 19,995 |
Pass display={{ mode: "compact" }} and onComplete={() => setCompletedCount(count => count + 1)} inline. Count child renders and count derivations immediately before filtering and sorting.
Without development Strict Mode's extra checks, mount, toggle theme, complete one lab, then type r, re, react. That is 1 + 1 + 1 + 3 = 6 child renders and 6 derivations. Keep Strict Mode in real apps and compare Profiler commits if local counters include extra calls.
Stop avoidable child renders with memo and stable props
Wrap the child as const ResultsList = memo(function ResultsList(props) { ... }). React's memo reference says each prop is compared with its previous value using Object.is. This is an optimization, not a correctness guarantee.
memo alone fails here. The object literal and inline callback are new references after every parent render. Pass the primitive mode="compact", then stabilise the callback:
const handleComplete = useCallback(() => {
  setCompletedCount(count => count + 1);
}, []);
The updater reads no outer completedCount, so this empty dependency list is correct. Repeat the harness. LabExplorer still renders 6 times. ResultsList renders 4 times: mount plus three query changes. Theme and completion save two child renders, but filter and sort still run 4 times.
Cache the expensive derivation with useMemo
Cache the pure calculation by its actual inputs:
const visibleLabs = useMemo(() => {
  console.count("derive visible labs");
  const needle = query.toLowerCase();
  const matches = needle
    ? labs.filter(lab => lab.name.toLowerCase().includes(needle))
    : [...labs];
  return matches.sort((a, b) => b.score - a.score);
}, [labs, query]);
The copy protects module-level labs when the query is empty. React's useMemo reference describes caching a result while dependencies remain unchanged, but correctness cannot depend on the cache.
memo can skip the child when props are unchanged. useMemo reuses visibleLabs but does not prevent another render. useCallback caches the function definition and matters here because its identity crosses a memoized boundary.
useMemo and useCallback in React: Runnable Examples, Render Counts and Traps isolates value identity, function identity, and dependency traps. In LabExplorer, those hooks are two steps in a longer diagnosis that begins with a Profiler commit and continues through state placement, bounded DOM work, and deferred scheduling.
Add local selectedId state and click IDs 1, 2, and 1. Child renders rise from 4 to 7. Since labs and query stay unchanged, derivations remain 4. This harness result is not a device-independent millisecond claim.
Reduce the work before adding more memoization
Put state near its consumer: theme near the page shell, completedCount near CompletedBadge, and selectedId in ResultsList. Narrow ownership keeps unrelated branches out of update paths.
Bound the DOM too. This query matches 8,000 records but renders only 20. A scrollable catalogue can use windowing for the visible slice and a small buffer. useMemo does not make 8,000 rows cheap. Use record IDs as keys, not indexes that shift after filtering.
Committed HTML still controls layout, accessibility, and interaction. Browser work can remain the bottleneck after React skips a calculation, so inspect DOM size and layout alongside component commits.
Keep typing responsive with useDeferredValue
Keep the input on immediate state and pass const deferredQuery = useDeferredValue(query) to the expensive branch. React says a deferred value may lag so a non-critical view updates later. It promises no fixed delay or debounce interval.
For re, three names match per cycle: 20,000 x 3 / 5 = 12,000. For rea, 20,000 x 2 / 5 = 8,000; react also gives 8,000. The input shows every string immediately while results may retain an earlier set. The final screen shows 8,000 matches, led by IDs 1, 2, and 6.
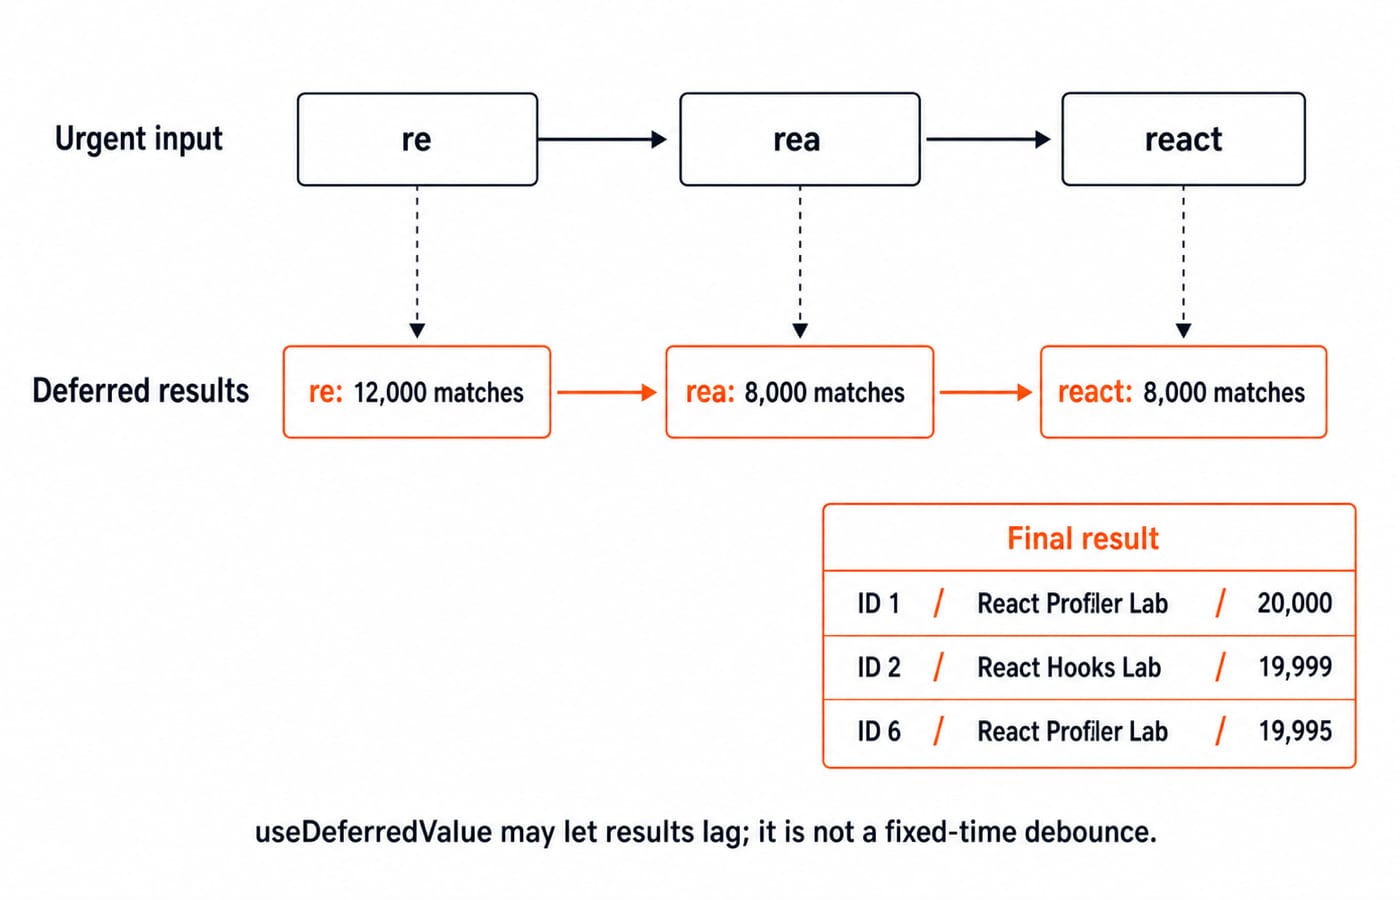
Deferral changes priority. It does not reduce the final calculation, fix request waterfalls, or replace windowing. If updates stay expensive, reduce or move the data work, or window the rows.
Common React performance mistakes and practical checks
Fresh props defeat
memo. A new object or function fails the identity check. Stabilise the meaningful boundary.useMemohides faulty logic. Fix correctness first, then cache pure work.Missing dependencies freeze stale inputs. Include every reactive value used by the calculation.
Memoization everywhere adds complexity. Profile the interaction and retain only useful optimizations.
Check your model. If a theme toggle renders the memoized child, inspect fresh object and function props. The six-step harness should show 6 baseline derivations and 4 after stable props plus memo. For redux, one name in five matches, so 20,000 x 1 / 5 = 4,000; the first rows are ID 3 at 19,998, ID 8 at 19,993, and ID 13 at 19,988.
Diagnose in this order: Profiler evidence, component boundary, prop identity, dependencies, state ownership, row count, then scheduling. API behaviour follows React's official Profiler, memo, useMemo, useCallback, and useDeferredValue references. The counters come from this harness, not React-wide benchmarks.
React performance optimization, the short version
Use Profiler to locate repeated work, memo for a costly child with unchanged props, useMemo for costly pure calculation, and useCallback when identity matters at a memoized boundary. Move state down and render fewer rows first. Use useDeferredValue when a non-critical view may lag behind urgent input.
Practise components, state, and Redux with the React and Redux Course. For filtering, sorting, closures, or updater functions, start with the Complete JavaScript Course. Browse Free Courses for the wider route.
Rebuild the six-step baseline and verify 6 child renders and 6 derivations. Apply stable props plus memo and verify 4. Then add the three selection clicks and confirm 7 child renders but still only 4 derivations after useMemo.
Keep learning

Future Internet Explained: Architecture, a Worked IoT Example and Exam Traps
Learn how device, edge, network, cloud and application layers cooperate, then solve a smart-campus example for data reduction and control-loop latency.
Updated 16 Nov 20266 min readWeb Development

Testing React Components: A Runnable Vitest and Testing Library Tutorial
Build and test a small React progress component from its initial render through completion. The examples use accessible queries, awaited actions, and an exact mock assertion.
Updated 15 Nov 20266 min readWeb Development

Node.js Path and OS Modules: Build Portable Scripts with Runnable Examples
Learn how Path and OS remove hard-coded assumptions from Node.js scripts. Follow deterministic examples, memory maths, and a complete system-report build.
Updated 13 Nov 20265 min readWeb Development

NPM and package.json in Node.js: Setup, Scripts, Dependencies, and SemVer
Build a small Node.js project from an empty folder, install Lodash, add reusable npm scripts, compare the manifest and lockfile, and practise SemVer ranges.
Updated 12 Nov 20266 min readWeb Development