

k-Nearest Neighbours (KNN): Choose k, Scale Features and Classify Correctly
Learn KNN through a hand-worked classification example, then build the correct order for scaling features, selecting k and evaluating the model.
KnowledgeGate Team
Exam prep & CS education
Updated 19 Nov 20265 min read

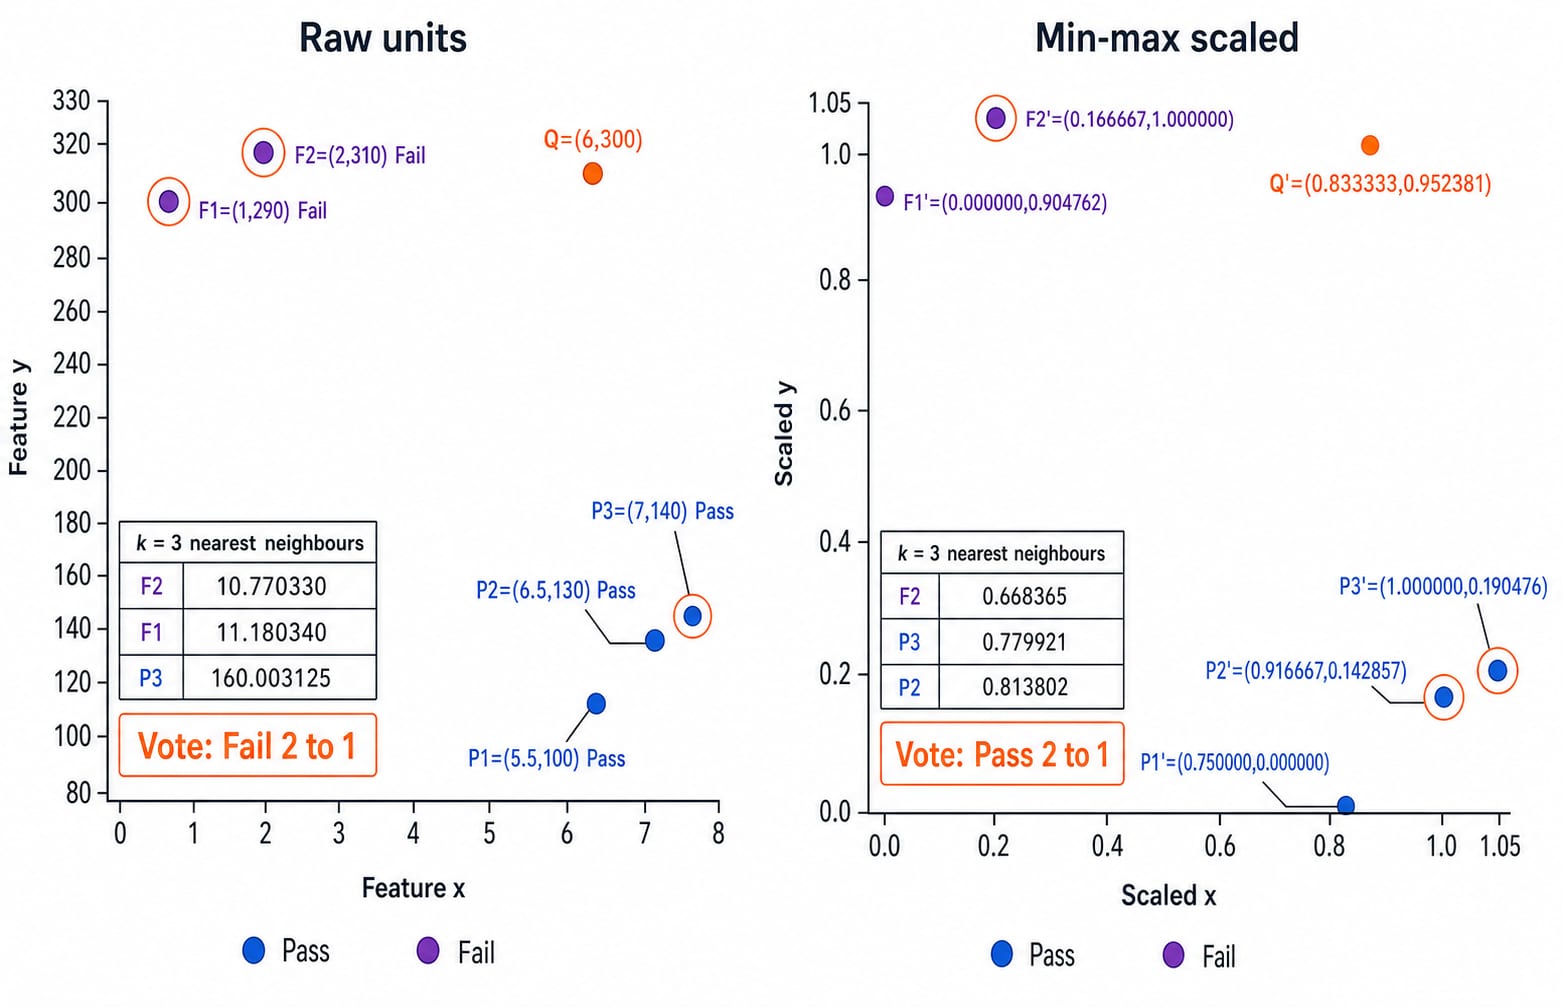
KNN looks like a four-step algorithm, yet a prediction can go wrong for two avoidable reasons. A large-unit feature can dominate distance, while an arbitrary k can make the decision boundary noisy or too smooth. In the worked dataset, the same k=3 vote changes from Fail in raw units to Pass after min-max scaling. A clean workflow splits the data first, fits scaling on training folds, chooses k on validation and opens the test set once.
1. k-Nearest Neighbours predicts from nearby stored examples
k-Nearest Neighbours is a non-parametric, instance-based method. For a new row it runs four steps: measure the distance to every training row, rank those distances, keep the nearest k rows, then aggregate their labels. Classification uses a majority or weighted vote. Regression uses a mean or weighted mean. Unlike a linear model, KNN forms its boundary at prediction time without a fitted equation.
For two features, Euclidean distance is d(a,b) = sqrt((a_1-b_1)^2 + (a_2-b_2)^2). Manhattan distance is |a_1-b_1| + |a_2-b_2|. For A=(3,4) and B=(0,0), these are sqrt(3^2+4^2)=5 and 3+4=7. The metric changes which points count as near.
For the wider applied-learning path, use Skill Development Courses. Approaches to AI explains the wider learning and search context around KNN.
2. KNN distance calculation in raw units can produce the wrong neighbourhood
Five training points use study hours and practice-question count as features. Query Q=(6,300) has a hidden outcome.
Point | Study hours per week | Practice questions | Outcome |
|---|---|---|---|
P1 | 5.5 | 100 | Pass |
P2 | 6.5 | 130 | Pass |
P3 | 7 | 140 | Pass |
F1 | 1 | 290 | Fail |
F2 | 2 | 310 | Fail |
Calculate each raw Euclidean distance from Q:
d(Q,P1)=sqrt(0.5^2+200^2)=200.000625d(Q,P2)=sqrt(0.5^2+170^2)=170.000735d(Q,P3)=sqrt(1^2+160^2)=160.003125d(Q,F1)=sqrt(5^2+10^2)=11.180340d(Q,F2)=sqrt(4^2+10^2)=10.770330
The order is F2, F1, P3, P2, P1. At k=3, two Fail votes beat one Pass vote. A 10-question difference outweighs several hours because that axis has a larger range. KNN has no coefficient to undo this mismatch.
3. KNN feature scaling changes distance, neighbours and the final vote
Fit min-max scaling on the five training rows only, using x'=(x-min)/(max-min). The training bounds are 1 to 7 for hours and 100 to 310 for questions. Therefore:
Q'=((6-1)/6,(300-100)/210)=(0.833333,0.952381)
The transformed training points are:
P1'=(0.750000,0.000000)P2'=(0.916667,0.142857)P3'=(1.000000,0.190476)F1'=(0.000000,0.904762)F2'=(0.166667,1.000000)
Recalculating Euclidean distance gives P1 0.956020, P2 0.813802, P3 0.779921, F1 0.834693, and F2 0.668365. The new order is F2, P3, P2, F1, P1. With the same k=3, F2 votes Fail, while P3 and P2 vote Pass. The scaled prediction changes to Pass by 2 votes to 1.
Scaling does not prove that Pass is the correct real-world label. It makes the selected distance metric compare the two features on commensurate numerical scales.
4. KNN preprocessing must fit the scaler without data leakage
No scaler always wins. Min-max scaling maps the training range to an interval but is sensitive to extremes. Standardisation uses z=(x-mu_train)/sigma_train for different units. Robust scaling uses the training median and interquartile range when outliers destabilise other measures. Validate the choice.
Split first. Fit the scaler on training data, then transform training, validation and test rows with those parameters. Tune KNN inside cross-validation, refitting the scaler in each training fold. Test once at the end. Scaling before splitting leaks later distribution information.
An implementation pipeline places StandardScaler() before KNeighborsClassifier(), then cross-validates n_neighbors, metric and weights. Python is the usual language for building it.
One-hot encode unordered categories instead of inventing distances such as red=1, blue=2, green=3. Preserve meaningful binary indicators, scale numerical columns, validate feature weighting, and never pass the target label to the scaler.
5. Choose k with validation, not with the test answer
k=1 can reproduce noise and form a jagged boundary. A very large k washes out local structure and tends towards the majority class. Odd values reduce two-class ties, not every multiclass or weighted tie.
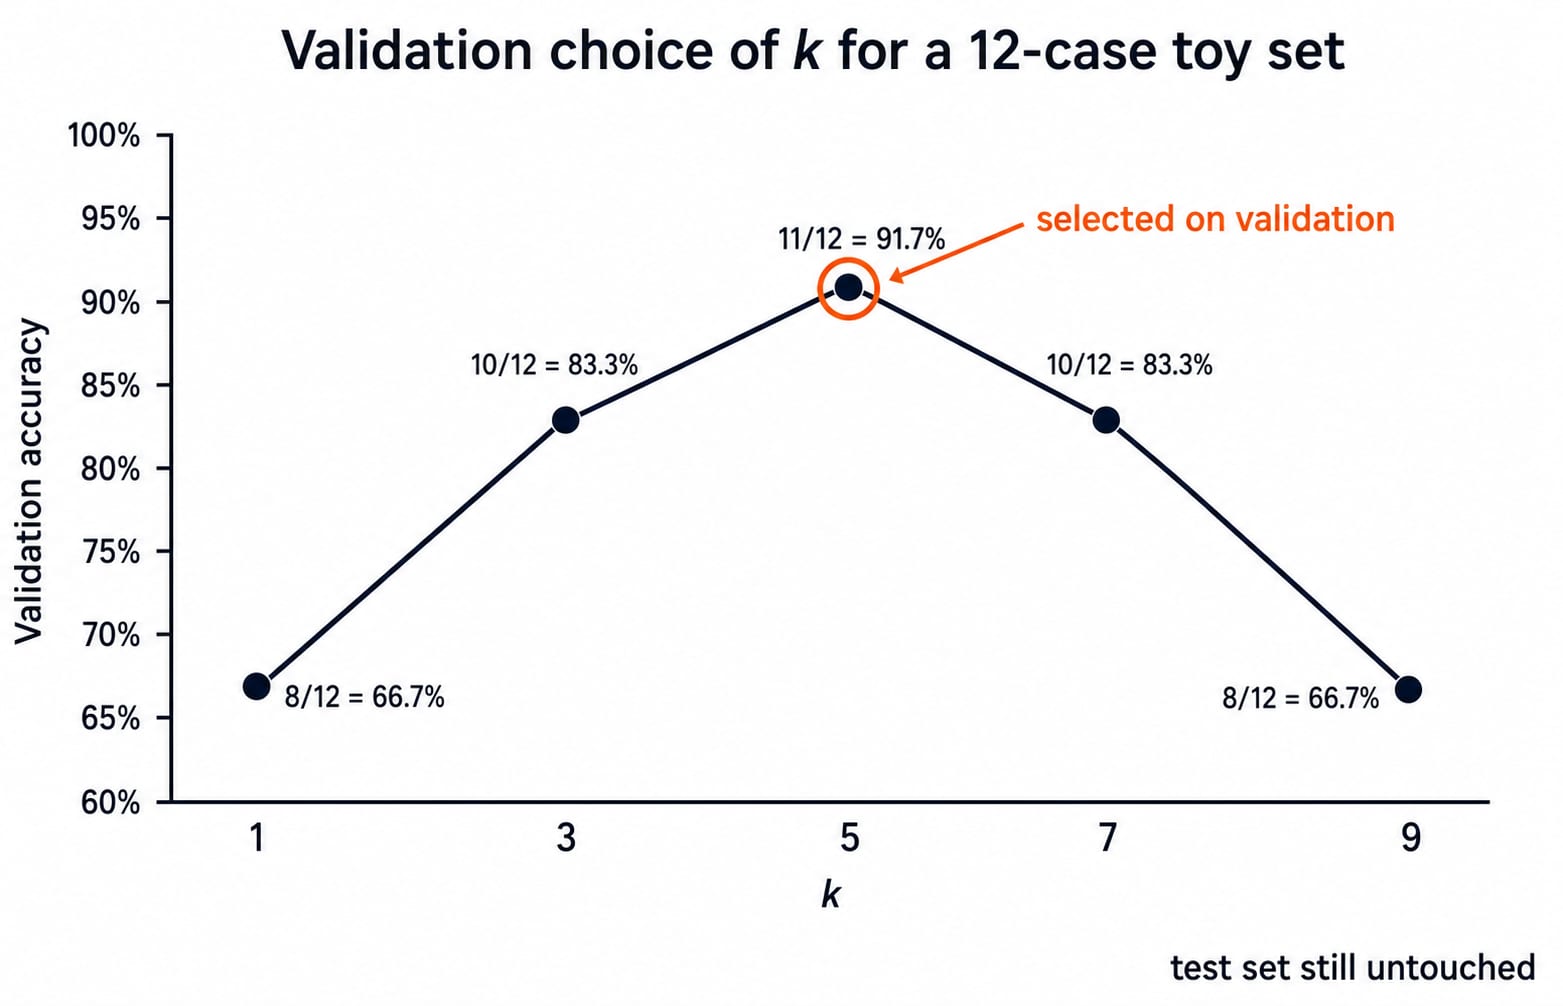
For 40 training rows and 12 validation rows, the illustrative results are:
k | Correct validation predictions | Validation accuracy |
|---|---|---|
1 | 8/12 | 66.7% |
3 | 10/12 | 83.3% |
5 | 11/12 | 91.7% |
7 | 10/12 | 83.3% |
9 | 8/12 | 66.7% |
The grid selects k=5 because 11 out of 12 is its best validation result. These illustrative values do not estimate real-world performance.
Odd values near sqrt(n_train) can start a grid, only as a heuristic. Use stratified cross-validation and a metric matching the error cost. For imbalanced labels, compare balanced accuracy, precision, recall or F1. Keep test data untouched and k within the smallest fold's training-row count.
6. KNN mistakes: metric, outliers, irrelevant features and voting
Mistake | What goes wrong | Repair |
|---|---|---|
Leave a large-unit feature unscaled | It dominates distance | Scale numerical columns in the pipeline |
Fit the scaler before splitting | Later distribution information leaks | Split first and fit within each training fold |
Choose | Test data guides selection | Validate first, then test once |
Include an irrelevant numerical column | Noise changes every distance | Select features with domain knowledge and validation |
Use min-max scaling with an extreme outlier | Ordinary values become compressed | Validate robust scaling |
Assign integers to nominal categories | Fake order enters distance | One-hot encode them |
Irrelevant features make distances less informative, so the nearest point may not be meaningfully near. Use domain-led feature selection or validated dimensionality reduction inside each training fold.
Uniform voting gives two Pass votes. With inverse-distance weights, F2 gives Fail 1/0.668365=1.496. P3 and P2 give Pass 1/0.779921 + 1/0.813802 = 1.282 + 1.229 = 2.511, so Pass remains ahead. Handle a zero-distance match directly. Validate uniform versus distance weighting.
7. KNN exam and interview questions test calculation plus modelling judgement
Stable questions ask for distances, nearest neighbours, a classification vote or regression mean, changed order after scaling, leakage diagnosis, the k trade-off, or a validation choice.
Check 1: For A=(3,4) and B=(0,0), find both distances.
Answer: Euclidean is 5. Manhattan is 7.
Check 2: What does raw k=3 predict?
Answer: Fail, from the F2 and F1 votes.
Check 3: What does scaled k=3 predict?
Answer: Pass, from the P3 and P2 votes.
Check 4: Which value does validation select?
Answer: k=5, from 11 out of 12 validation predictions, not a test score.
For n rows and d features, brute-force distance per query costs O(nd). Full sorting costs O(n log n), while retaining the best k can use O(n log k). Storage costs O(nd). Neural networks use a different representation, covered in Artificial Neural Networks MCQs.
8. KNN: the short version and next step
Split first.
Fit numerical scaling on training data only.
Transform later data with the training parameters.
Validate distance, weights and
ktogether.Use an evaluation metric suited to label balance and error cost.
Evaluate once on the untouched test set.
Remember three checkpoints. Raw distances give F2, F1, P3 and Fail. Min-max distances give F2, P3, P2 and Pass. Validation selects k=5 at 11 out of 12, with test results unseen.
Reproduce the five scaled distances on paper, then implement the pipeline and check its neighbour order. For broader study, Artificial Intelligence (AI) is a structured route.
Keep learning

ctype.h Functions in C: Classify Characters and Convert Case Safely
Learn which character test to choose, trace a complete C classifier, and avoid signed-char and EOF mistakes. Worked examples separate classification from case conversion.
Updated 30 Oct 20266 min readC

Covariance and Correlation for Machine Learning: Read Feature Relationships Correctly
Calculate covariance and Pearson correlation by hand, then see how units, influential points and nonlinear patterns change what the numbers mean.
Updated 14 Nov 20266 min readML & Data Science

SSC CGL Cutoffs Explained: Compare Tiers, Posts and Categories
A practical test for deciding whether two SSC CGL cutoff figures are genuinely comparable, with completed-result examples and a worksheet for rejecting mismatched rows.
Updated 30 Oct 20265 min read65 viewsSSC CGL

Java Features and Basics MCQs: 12 Solved Questions with Explanations
Test your Java foundation with 12 solved MCQs, then trace the rules behind compilation, naming, classes, packages and two small programs.
Updated 16 Nov 20267 min readJava