SSC CGL Cutoffs Explained: Compare Tiers, Posts and Categories
A practical test for deciding whether two SSC CGL cutoff figures are genuinely comparable, with completed-result examples and a worksheet for rejecting mismatched rows.
KnowledgeGate Team
Exam prep & CS education
Updated 19 Aug 20265 min read
A cutoff copied from a table is meaningless until you know its cycle, decision stage, post or list, category and score basis. Comparing a Tier 1 screening line with a final post-allocation line can create a confident but false target. You get a five-field test, two completed-result examples and a worksheet that rejects false precision. Every official SSC figure below comes from the completed CGLE 2024 final result and cannot predict a later cycle.
SSC CGL cutoff meaning: identify the decision before the number
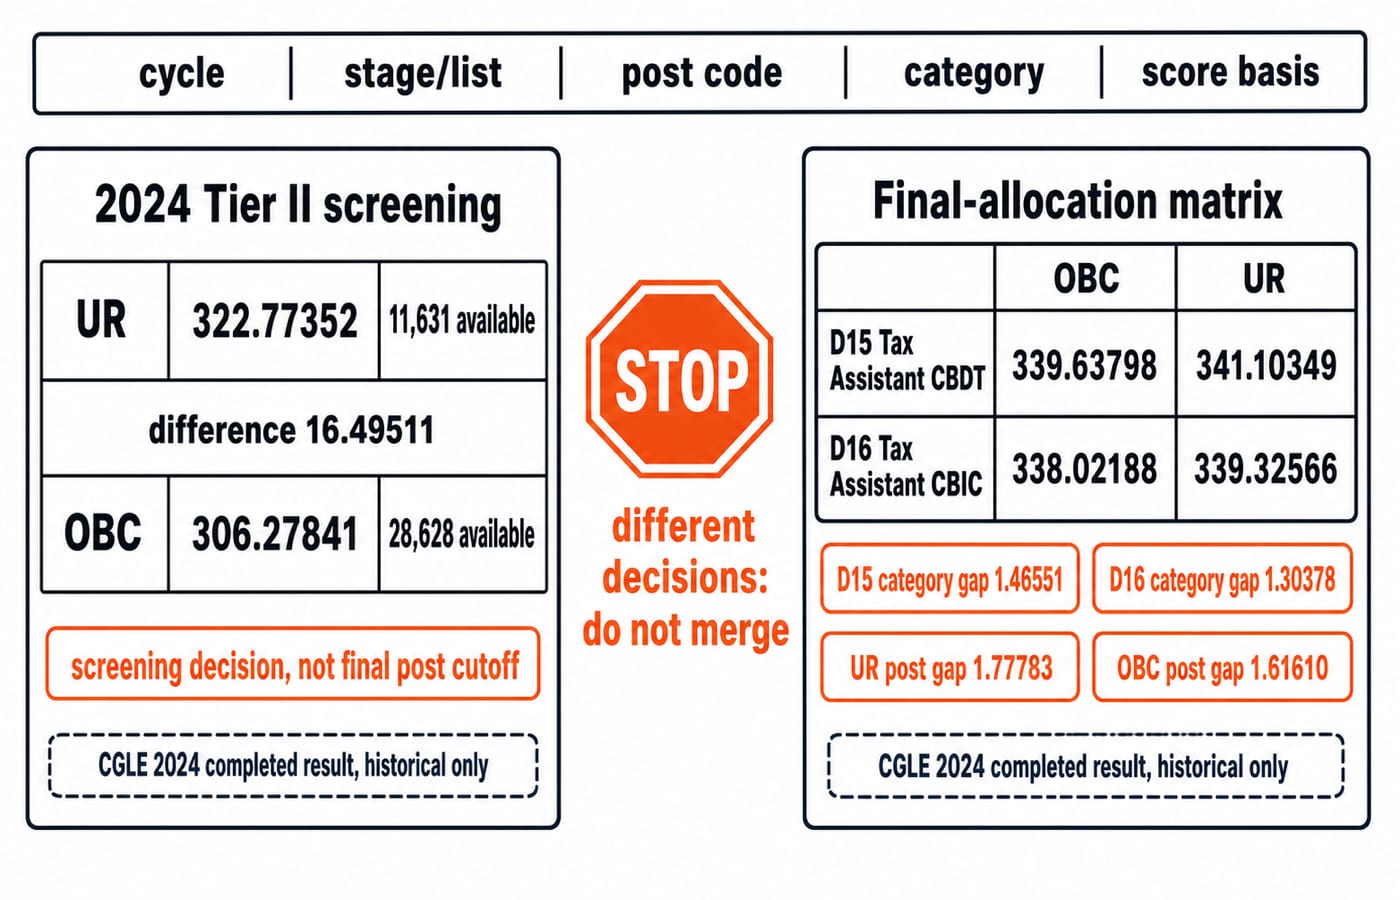
A cutoff is one decision's boundary, not a permanent exam property. Record cycle | stage/list | post or post group | category | score basis. Add vacancy and preference context as a sixth field, not a formula. The SSC CGL Exam Preparation hub organises wider preparation.
Comparison | Verdict |
|---|---|
Same cycle, stage, post/list, category and score basis | Comparable |
Different tier or stage | Reject |
Different post code | Reject |
Different category row | Reject |
Raw versus normalized/reported score | Reject |
Same five fields but different cycle | Historical context only |
Historical values come from the completed CGLE 2024 final-result write-up. For your cycle, take marks, vacancies, categories, tie rules and allocation conditions from the applicable SSC notice and result.
SSC CGL tier cutoffs: screening and final allocation answer different questions
For Tier II Paper I Section I plus Section II, for all posts except Statistical Investigator Grade II, that write-up reported UR 322.77352 with 11,631 candidates available, and OBC 306.27841 with 28,628 available. Their difference is:
322.77352 - 306.27841 = 16.49511 marks
Those rows governed later qualifying-module evaluation and further selection. They were not Tier 1 cutoffs, final Tax Assistant cutoffs or future targets. Reject “SSC CGL cutoff was 322.77”. Retain “in the completed 2024 result, SSC reported 322.77352 for the UR row at that Tier II screening decision for the relevant post group”.
The SSC CGL Tier 1 course covers General Intelligence and Reasoning, Quantitative Aptitude, English Comprehension and General Awareness. It is not the cutoff source.
SSC CGL post-wise cutoffs: a two-post, two-category matrix
The same write-up reports the last selected candidate's total marks:
Post | OBC | UR |
|---|---|---|
D15, Tax Assistant in CBDT | 339.63798 | 341.10349 |
D16, Tax Assistant in CBIC | 338.02188 | 339.32566 |
The four within-matrix differences are:
D15 category gap:
341.10349 - 339.63798 = 1.46551D16 category gap:
339.32566 - 338.02188 = 1.30378UR post gap:
341.10349 - 339.32566 = 1.77783OBC post gap:
339.63798 - 338.02188 = 1.61610
Post code and category change the boundary. These gaps create no universal category adjustment or forecast. Merit-cum-preference and vacancies make post identity essential. See SSC CGL Posts Explained: How to Set Your Preference Order.
SSC CGL category cutoffs: compare the row, not a stereotype
Against historical D15, an illustrative 340.00000 is 340.00000 - 339.63798 = 0.36202 above the OBC last-selected total, but 341.10349 - 340.00000 = 1.10349 below the UR total. Say only above or below that row. Eligibility, preference, vacancies, qualifying modules, ties and verification remain outside it.
SSC tables can carry vertical and horizontal category labels. Follow the applicable official notice. Never call the 1.46551 D15 gap “OBC relaxation”. It is an observed row gap, not a reusable concession.
SSC CGL normalized scores: compare like score bases
Consider a purely illustrative two-shift example. Candidate A moves from raw 151.00 to reported normalized 154.37, so 154.37 - 151.00 = 3.37. Candidate B moves from raw 153.00 to reported normalized 152.80, so 152.80 - 153.00 = -0.20.
On raw marks, B leads by 153.00 - 151.00 = 2.00. On reported normalized scores, A leads by 154.37 - 152.80 = 1.57. Never compare a raw mock score directly with a published normalized cutoff or infer a formula. Record raw, normalized/reported and cutoff basis separately. Let the cycle's notice or result identify the basis.
SSC CGL vacancy mix: record context without predicting
Illustratively, 120 vacancies in Cycle A and 75 in Cycle B means 120 - 75 = 45 fewer, or 45 / 120 x 100 = 37.5% lower. This cannot prove a cutoff rise because score distribution, preferences, qualifying conditions and competing rows also change.
Use these worksheet columns: cycle, result date, tier/decision, list/post code, category, raw or normalized/reported basis, cutoff or last-selected score, vacancy row, candidate count if reported, official source. A blank key field means “do not compare”, not “estimate it”.
Clean four records: retain A because all five keys match. Reject B for a different post code, C for a different category, and D for pairing a raw coaching-test score with an official reported score. One observation remains, so compute no average or trend.
SSC CGL historical cutoffs: build a cautious study reference
An illustrative same-cell series 337.50, 341.10, 339.30 sorts to 337.50, 339.30, 341.10. Its range is 341.10 - 337.50 = 3.60; its median is 339.30.
A mock sequence 345, 342, 347 sorts to 342, 345, 347, with median 345 and lowest 342. The lowest-score margin over the illustrative historical maximum is 342 - 341.10 = 0.90. This is a preparation buffer, not a probability or safe-score promise. After all five fields match, use SSC CGL Cut Offs: Set a Target Score by Category.
SSC CGL cutoff comparison: the short version
Ask six questions:
Is it the same cycle, or clearly an historical comparison?
Is it the same stage or list?
Is it the same post or post group?
Is it the same category row?
Is it the same score basis?
Are vacancy and preference context recorded?
If any of the first five answers is no, stop the numerical comparison.
Preparation route | KnowledgeGate coverage buckets |
|---|---|
Tier 1 course | General Intelligence and Reasoning, Quantitative Aptitude, English Comprehension, General Awareness |
Tier 2 course | Mathematical Abilities, Reasoning and General Intelligence, English Language and Comprehension, General Awareness, Computer Knowledge and Test Preparation |
These are KnowledgeGate coverage buckets, not official marks or weightage. The SSC CGL Tier 2 course structures them. Alternatively, use the current official notice, worksheet and weak-area plan. Compare like with like, then treat old cutoffs as context, not promises.
Keep learning
SSC MTS Eligibility and Selection Process: Age, Qualification and Stages
Check your qualification date and birth-date window before planning preparation. This dated SSC MTS example explains age relaxation, the two CBE sessions and Havaldar's additional physical tests.
Updated 5 Oct 20264 min readSSC CGL
SSC CHSL Cutoff Trends: Compare Results and Set a Target Score
Compare the right CHSL result rows before choosing a practice target. Work through a historical benchmark, a personal buffer and two mock-test blocks to decide what to improve next.
Updated 30 Sep 20264 min readSSC CGL
SSC CGL Mock Analysis: Build an Error Ledger That Guides Every Revision
Turn each useful mock error or delay into evidence, a focused drill, a retest date, and a clear decision to close or reopen the row.
Updated 17 Aug 20265 min readSSC CGL
SSC CGL Post Duties and Posting Patterns: A Preference Guide
Compare SSC CGL posts by duty family, eligibility, posting uncertainty and personal fit. Use the worked scoring method to build an order you would genuinely accept.
Updated 15 Aug 20266 min readSSC CGL