The bar graph given below shows the sales of five different products (in…
2021
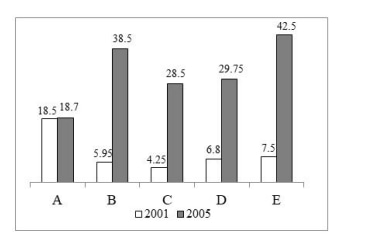
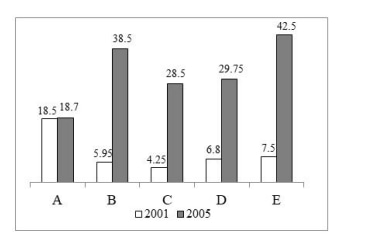
The bar graph given below shows the sales of five different products (in lakhs) A, B, C, D and E during 2001 and 2005 by a company. I. In 2001 sales of product B is 56.67 percent more than the sales of product C. II. In 2001 sales of product A is 146.67 percent more than the sales of product E. III. Ratio of sales of product C in 2001 to the sales of product D in 2005 is 1 : 7.
Answer: D. Both II and III — Extract data (2001 sales): A=18.5, B=5.95, C=4.25, D=6.8, E=7.5. Extract data (2005 sales): D=29.75. Analyze Statement I: (B-C)/C * 100 = (5.95 - 4.25) / 4.25…
- A.
Only I
- B.
Only II
- C.
Only III
- D.
Both II and III
Attempted by 81 students.
Show answer & explanation
Correct answer: D
Extract data (2001 sales): A=18.5, B=5.95, C=4.25, D=6.8, E=7.5.
Extract data (2005 sales): D=29.75.
Analyze Statement I: (B-C)/C * 100 = (5.95 - 4.25) / 4.25 * 100 = 40%. (Statement I is incorrect).
Analyze Statement II: (A-E)/E * 100 = (18.5 - 7.5) / 7.5 * 100 = 146.67%. (Statement II is correct).
Analyze Statement III: Ratio C(2001) : D(2005) = 4.25 : 29.75 = 1 : 7. (Statement III is correct).
Since II and III are correct, the answer is "Both II and III".
Final Answer: Option 4