The bar graph given below shows the production of soaps (in thousands) by two…
2021
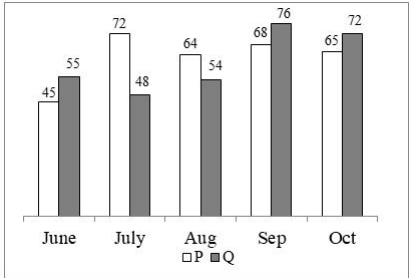
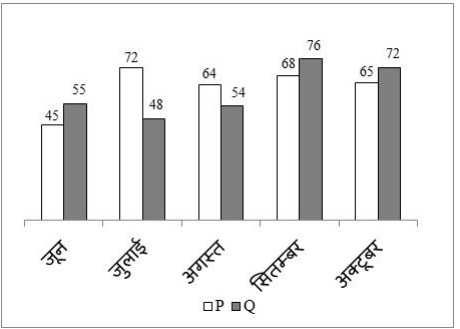
The bar graph given below shows the production of soaps (in thousands) by two companies P and Q from June to October. Which of the following statement(s) is/are correct? I. Total number of soaps produced by P in July is 28.5% more than Q in that month. II. Total number of soaps produced by P in August is 18.5% more than Q in that month. III. Total number of soaps produced by P and Q in September is 1,44,000.
Answer: D. II and III — ConceptIn a labelled bar graph, every bar carries its exact value printed on top, so no separate axis scale is needed to read the data — the printed figures…
- A.
Only I
- B.
Only II
- C.
Only III
- D.
II and III
Attempted by 120 students.
Show answer & explanation
Correct answer: D
Concept
In a labelled bar graph, every bar carries its exact value printed on top, so no separate axis scale is needed to read the data — the printed figures (here, in thousands) are the data. Two standard tools settle this item: percentage-excess of one quantity over another is (larger − smaller) / smaller × 100, computed on the SMALLER as the base; and a combined total is a simple sum, with “in thousands” meaning each printed number is multiplied by 1000.
Application
Read the values printed on the bars and test each statement against the figures it names:
July (Statement I): P = 72, Q = 48. Excess of P over Q = (72 − 48) / 48 × 100 = 24 / 48 × 100 = 50%. The statement’s figure of 28.5% does not match 50%, so this statement does not hold.
August (Statement II): P = 64, Q = 54. Excess = (64 − 54) / 54 × 100 = 10 / 54 × 100 = 18.51…% ≈ 18.5%. This matches the statement, so it holds.
September (Statement III): P = 68, Q = 76 (thousand). Combined production = 68 + 76 = 144 thousand = 144 × 1000 = 1,44,000. This matches the statement, so it holds.
Cross-check
Re-base each percentage on the correct denominator (Q, the smaller July value 48 and the August value 54) to confirm: 24 is exactly half of 48 (50%), and 10 / 54 sits just below one-fifth (20%), landing at ≈ 18.5% — consistent with the figures above. The September sum 68 + 76 reverses to 144, and scaling by the “thousands” unit gives 1,44,000.
Result
The August (18.5%) and September (1,44,000) statements are the two that hold; the July (28.5%) statement does not.