The bar graph given below shows the amounts (in lakhs) invested and value of…
2021
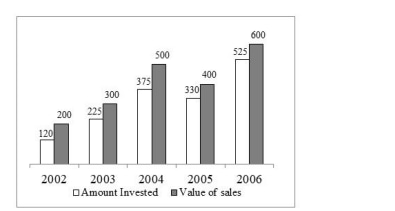
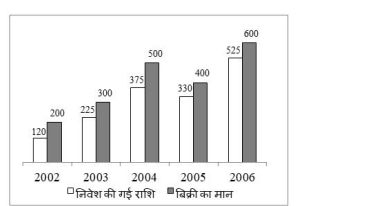
The bar graph given below shows the amounts (in lakhs) invested and value of sales (in lakhs) of goods by a company in the 5 years. Given: J1 = Average amount invested from 2002 to 2006 J2 = Average sales of goods from 2002 to 2006 J3 = Difference between the amount invested and value of sales in 2005 What is the value of J2 − J1 + J3?
Answer: B. 155 — Step-by-Step Calculation Extract Data: Invested Amounts: 120, 225, 375, 330, 525 Sales Values: 200, 300, 500, 400, 600 Calculate J1 (Average Investment): Sum…
- A.
150
- B.
155
- C.
260
- D.
165
Attempted by 94 students.
Show answer & explanation
Correct answer: B
Step-by-Step Calculation
Extract Data:
Invested Amounts: 120, 225, 375, 330, 525
Sales Values: 200, 300, 500, 400, 600
Calculate J1 (Average Investment):
Sum of investments = 120 + 225 + 375 + 330 + 525 = 1575
J1 = 1575 / 5 = 315
Calculate J2 (Average Sales):
Sum of sales = 200 + 300 + 500 + 400 + 600 = 2000
J2 = 2000 / 5 = 400
Calculate J3 (Difference in 2005):
Invested in 2005 = 330
Sales in 2005 = 400
J3 = 400 - 330 = 70
Final Calculation:
J2 – J1 + J3 = 400 – 315 + 70
85 + 70 = 155