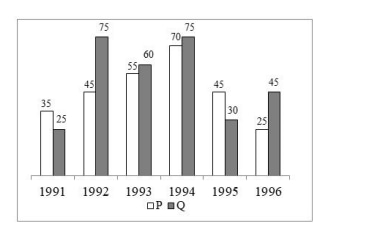
The bar graph given below shows the production of cars (in thousands) by two…
2021
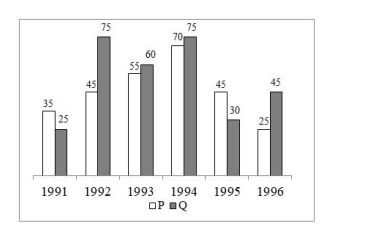
The bar graph given below shows the production of cars (in thousands) by two different companies P and Q over the years. Which of the following statement(s) is/are correct? I. Production of cars of company P increases by 57.14 percent from 1991 to 1993. II. Ratio of production of cars by company P in 1994 to the production of cars by company Q in 1996 is 14 : 9. III. Average production of cars by company P from 1991 to 1996 is 61677.
Answer: D. I and II — Step-by-Step Verification Statement I: Production of cars of company P increases by 57.14 percent from 1991 to 1993. Production of P in 1991 = 35 (in…
- A.
I and III
- B.
Only I
- C.
Only II
- D.
I and II
Attempted by 74 students.
Show answer & explanation
Correct answer: D
Step-by-Step Verification
Statement I: Production of cars of company P increases by 57.14 percent from 1991 to 1993.
Production of P in 1991 = 35 (in thousands)
Production of P in 1993 = 55 (in thousands)
Increase = 55 - 35 = 20
Percentage Increase = (Increase / Original) * 100 = (20 / 35) * 100 = (4 / 7) * 100 ≈ 57.14%
Status: Correct.
Statement II: Ratio of production of cars by company P in 1994 to the production of cars by company Q in 1996 is 14 : 9.
Production of P in 1994 = 70
Production of Q in 1996 = 45
Ratio P(1994) : Q(1996) = 70 : 45
Simplifying by dividing by 5: 14 : 9
Status: Correct.
Statement III: Average production of cars by company P from 1991 to 1996 is 61677.
Production of P (1991-1996) = 35 + 45 + 55 + 70 + 45 + 25 = 275
Average = Total / Number of years = 275 / 6 ≈ 45.83 (thousands)
The figure 61677 is incorrect.
Status: Incorrect.
Conclusion
Statements I and II are correct. Therefore, the correct option is D (I and II).