Study the given graph and answer the following question. Production of rice by…
2023
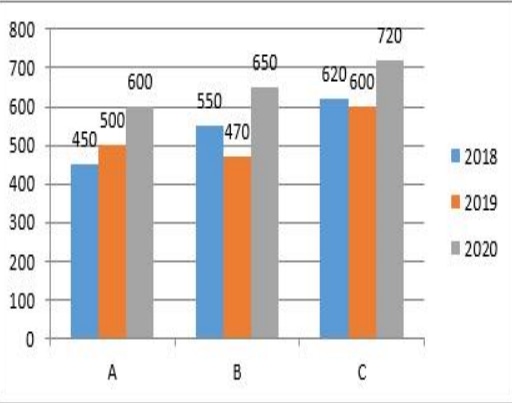
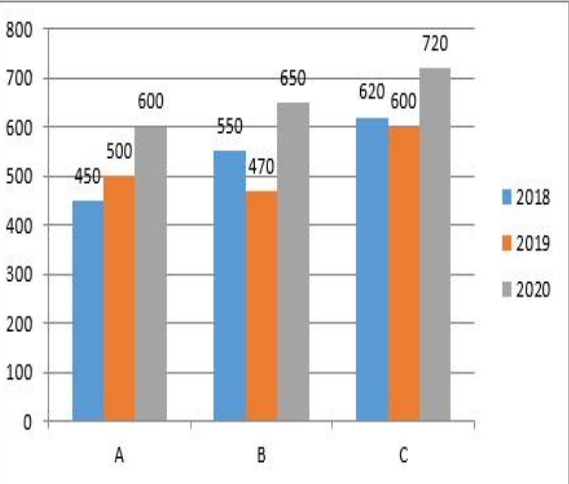
Study the given graph and answer the following question. Production of rice by states A, B and C during 2018 to 2020 (in lakh tonnes).
The average production of rice (per year) by states A, B and C in 2018 is what percentage less than the production of rice by state C in 2020?
Answer: C. 25 % — Solution: Calculate the average production in 2018 and compare it with state C in 2020. Step 1: Read values for 2018: A = 450, B = 550, C = 620 (lakh tonnes).…
- A.
18 %
- B.
20 %
- C.
25 %
Attempted by 147 students.
Show answer & explanation
Correct answer: C
Solution: Calculate the average production in 2018 and compare it with state C in 2020.
Step 1: Read values for 2018: A = 450, B = 550, C = 620 (lakh tonnes).
Step 2: Compute the average for 2018: (450 + 550 + 620) / 3 = 1620 / 3 = 540 (lakh tonnes).
Step 3: State C production in 2020 = 720 (lakh tonnes). Difference = 720 − 540 = 180.
Step 4: Percentage less = (difference / 720) × 100 = (180 / 720) × 100 = 25%.
Answer: 25%