The bar graph given below shows the number of shoes in 8 shops R = Difference…
2021
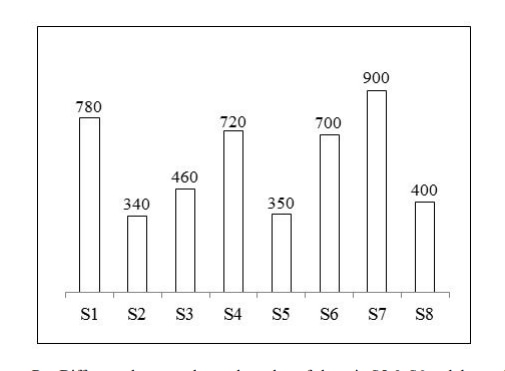
The bar graph given below shows the number of shoes in 8 shops R = Difference between the total number of shoes in S5 & S6 and the total number of shoes in S1 & S8. T = Average number of shoes in S2, S4 and S5. What is the value of R + T?
- A.
720
- B.
480
- C.
540
- D.
600
Attempted by 33 students.
Show answer & explanation
Correct answer: D
Step-by-Step Solution
1. Analyze the Given Data: First, identify the values for the relevant shops from the bar graph:
S1 = 780
S2 = 340
S4 = 720
S5 = 350
S6 = 700
S8 = 400
2. Calculate the Value of R: R is defined as the difference between the total shoes in (S5 & S6) and (S1 & S8).
Total of S5 and S6 = 350 + 700 = 1050
Total of S1 and S8 = 780 + 400 = 1180
Difference (R) = 1180 - 1050 = 130
3. Calculate the Value of T: T is defined as the average number of shoes in S2, S4, and S5.
Sum of shoes in S2, S4, and S5 = 340 + 720 + 350 = 1410
Average (T) = 1410 / 3 = 470
4. Calculate the Final Value (R + T):
R + T = 130 + 470 = 600