Read the following table carefully and answer the questions given below. The…
2025
Read the following table carefully and answer the questions given below. The table shows the total number of people, the ratio of males to females, and the number of graduates people out of the total people in five different towns.
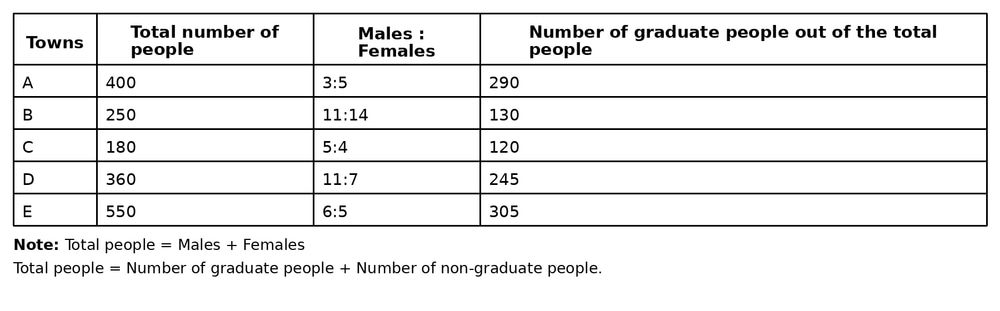
The non-graduate people in C are what percentage of the difference between the number of males in D and E?
Answer: C. 75% — ConceptIn a table-based Data Interpretation question, first translate every given relationship into a count: Total = Males + Females, and Total = Graduates +…
- A.
35%
- B.
80%
- C.
75%
- D.
50%
- E.
70%
Attempted by 11 students.
Show answer & explanation
Correct answer: C
Concept
In a table-based Data Interpretation question, first translate every given relationship into a count: Total = Males + Females, and Total = Graduates + Non-graduates. Where only a Males:Females ratio is given, split the town's Total in that ratio to get the actual count. A phrase such as "what percentage of X" is always evaluated as (that quantity ÷ X) × 100.
Application
Non-graduates in Town C = Total in C − Graduates in C = 180 − 120 = 60.
Town D: Total = 360, Males : Females = 11 : 7 (11 + 7 = 18 parts), so Males in D = (11 ÷ 18) × 360 = 220.
Town E: Total = 550, Males : Females = 6 : 5 (6 + 5 = 11 parts), so Males in E = (6 ÷ 11) × 550 = 300.
Difference between the males in D and the males in E = 300 − 220 = 80.
Required percentage = (Non-graduates in C ÷ that difference) × 100 = (60 ÷ 80) × 100 = 75%.
Cross-check
Confirm the ratio splits independently: Females in D = 360 − 220 = 140, and 220 : 140 reduces to 11 : 7, matching the given ratio for D. Females in E = 550 − 300 = 250, and 300 : 250 reduces to 6 : 5, matching the given ratio for E. With both male counts verified, 60 is exactly 75% of 80, so 75% is the answer.