Direction: Line graph given below shows percentage of managers out of total…
2020
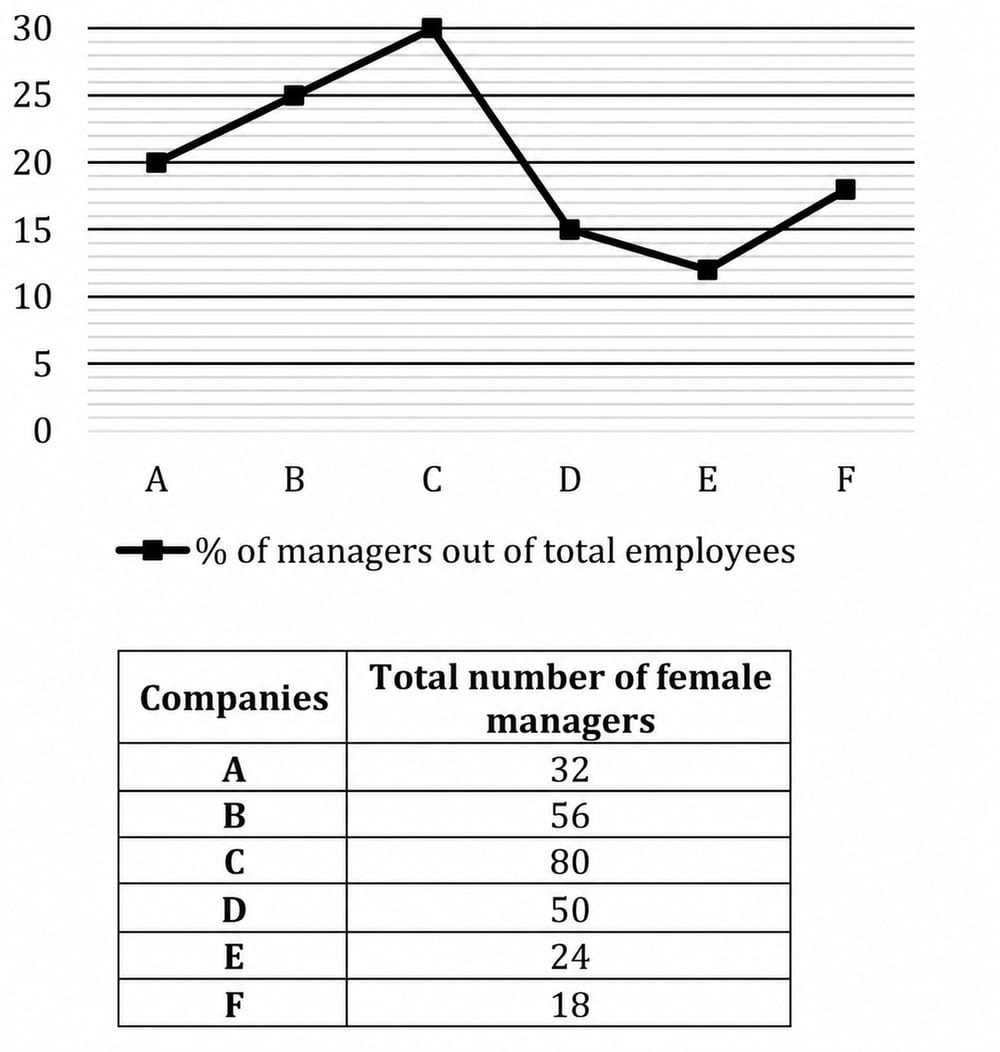
Direction: Line graph given below shows percentage of managers out of total employees in six (A, B, C, D, E & F) different companies and table shows number of female managers out of total managers in these six companies. Read the data carefully and answer the questions.
Out of total number of employee (Non managers + managers) in company B 40% are females. If out of Non managers employees in company B 40% are female employee, then find total number of Non managers employee in company B?
Answer: B. 420 — ConceptIn a workforce split into managers and non-managers, the total female count equals female managers plus female non-managers. So whenever the overall…
- A.
480
- B.
420
- C.
400
- D.
360
- E.
240
Attempted by 9 students.
Show answer & explanation
Correct answer: B
Concept
In a workforce split into managers and non-managers, the total female count equals female managers plus female non-managers. So whenever the overall female share and the female share among non-managers are both known, the female managers can be expressed as a difference of percentages of the total, which then unlocks the total head-count.
Application
Let the total number of employees in company B be T. From the line graph, managers in B are 25% of total, so managers = 0.25T and non-managers = 0.75T.
Overall, 40% of all employees are female, so total females = 0.40T.
Among non-managers, 40% are female, so female non-managers = 0.40 x 0.75T = 0.30T.
Female managers = total females - female non-managers = 0.40T - 0.30T = 0.10T.
From the table, female managers in B = 56, so 0.10T = 56, giving T = 560.
Non-managers = 0.75 x 560 = 420.
Cross-check
With T = 560: managers = 140, non-managers = 420, total females = 224, female non-managers = 0.40 x 420 = 168, hence female managers = 224 - 168 = 56, which matches the table value. So the non-manager count is 420.