Direction: Line graph given below shows percentage of managers out of total…
2020
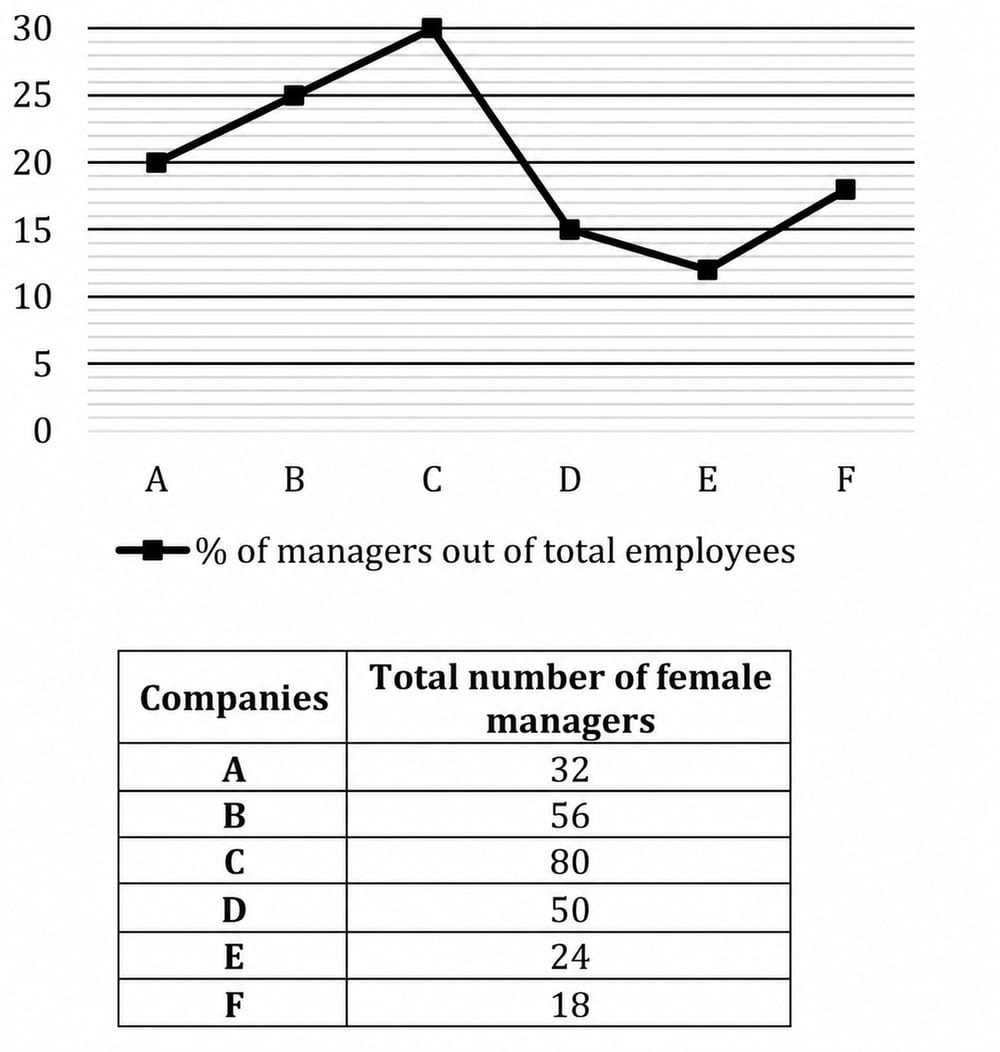
Direction: Line graph given below shows percentage of managers out of total employees in six (A, B, C, D, E & F) different companies and table shows number of female managers out of total managers in these six companies. Read the data carefully and answer the questions.
The difference between total male managers in company E and the total female managers in company E is 50% of total female managers in that company, then find total number of employees in company E (male mangers are more than female managers in company E)?
Answer: C. 500 — ConceptIn this data set the line graph gives the percentage of managers among all employees of a company, while the table gives only the number of female…
- A.
400
- B.
300
- C.
500
- D.
600
- E.
800
Attempted by 7 students.
Show answer & explanation
Correct answer: C
Concept
In this data set the line graph gives the percentage of managers among all employees of a company, while the table gives only the number of female managers. The governing relations are: Total managers = Male managers + Female managers, and Total managers = (manager percentage) × Total employees. So once the count of total managers is known, the total employees follow by dividing that count by the manager percentage (as a decimal).
Application (company E)
Read company E from the chart and table: managers are 12% of total employees, and the number of female managers is 24.
The stem says (male managers − female managers) equals 50% of the female managers, with male managers being the larger group. So the difference = 0.50 × 24 = 12, giving male managers = 24 + 12 = 36.
Total managers in E = male + female = 36 + 24 = 60.
Managers are 12% of employees, so total employees = 60 ÷ 0.12 = 500.
Cross-check
Take total employees = 500. Managers = 12% of 500 = 60. Splitting 60 into 36 male and 24 female, the male–female difference is 36 − 24 = 12, which is exactly 50% of the 24 female managers — and males (36) exceed females (24), matching every condition. So 500 is consistent.