Direction: Line graph given below shows percentage of managers out of total…
2020
Direction: Line graph given below shows percentage of managers out of total employees in six (A, B, C, D, E & F) different companies and table shows number of female managers out of total managers in these six companies. Read the data carefully and answer the questions.
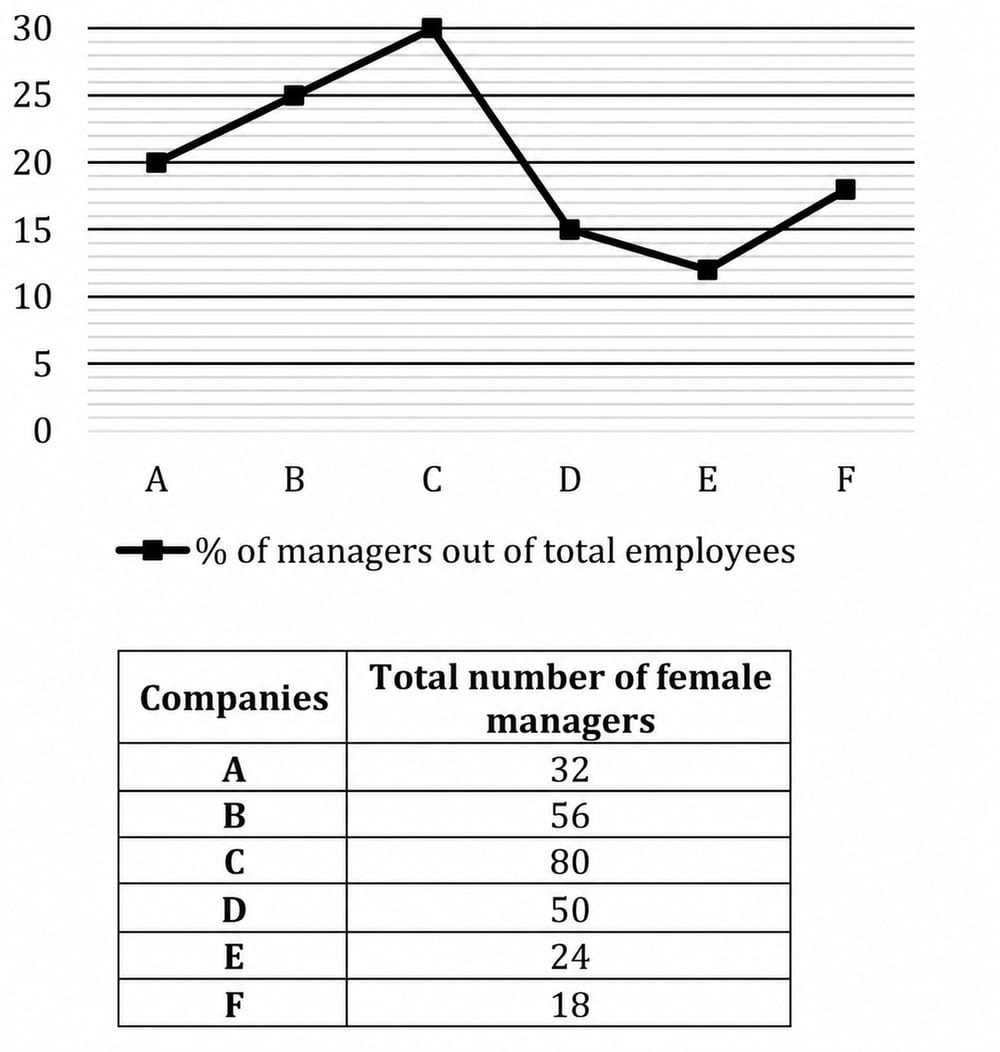
The ratio of total male managers in company F to total female managers in same company is 7 : 2. Find the number of total employee (Non managers) in company F?
Answer: D. 369 — ConceptIn data-interpretation problems, the percentage on the line graph links a company's managers to its total workforce: managers = (manager %) × total…
- A.
363
- B.
349
- C.
359
- D.
369
- E.
381
Attempted by 5 students.
Show answer & explanation
Correct answer: D
Concept
In data-interpretation problems, the percentage on the line graph links a company's managers to its total workforce: managers = (manager %) × total employees, so total employees = managers ÷ (manager %). A part-ratio (male : female) fixes the manager count once one part is known, because each ratio unit equals the same head-count.
Application
Read the data for company F from the two sources: the line graph gives the manager percentage as 18%, and the table gives the number of female managers as 18.
Use the male : female ratio 7 : 2. The 2 female-parts correspond to 18 female managers, so one ratio unit = 18 ÷ 2 = 9 managers, and the 7 male-parts give 7 × 9 = 63 male managers.
Add the parts to get the total managers: 63 + 18 = 81 managers (equivalently, 9 units × 9 = 81).
Convert the manager count to the workforce using the 18% figure: total employees = 81 ÷ 0.18 = 450.
Non-managers are the rest of the workforce: 450 − 81 = 369.
Cross-check
Non-managers form the remaining 100% − 18% = 82% of the workforce. Checking directly: 82% of 450 = 0.82 × 450 = 369, which matches the subtraction. Hence the number of non-manager employees in company F is 369.