Read the following line graph carefully and answer the questions given below.…
2024
Read the following line graph carefully and answer the questions given below. The line graph shows 1/3rd of the total items sold by five different shops in two different years.
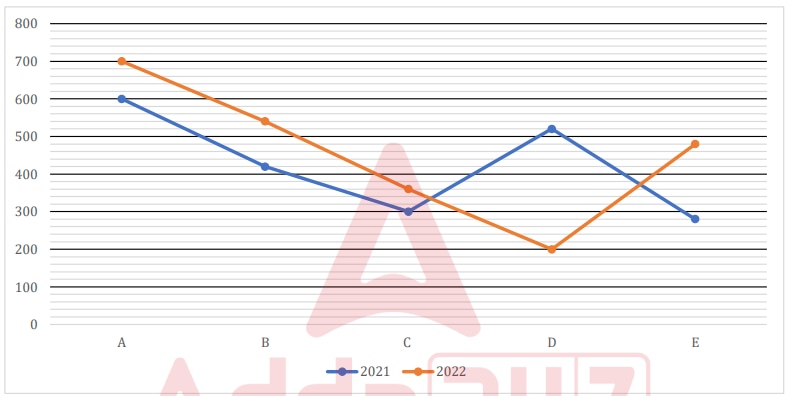
Note:
(i). Total number of items sold by each shops in 2023 is 20% more than that in 2021.
(ii). The total number of items sold by each shops in each year, which is given in the line graph, is one-third of the total items sold.
Total number of items sold by D in 2023 is what percentage less than the total number of items sold by A in 2022 (approx.)?
Answer: C. 11% — ConceptIn a data-interpretation graph, the plotted figure may represent only a fraction of the real quantity. To recover an actual total from a fraction,…
- A.
23%
- B.
19%
- C.
11%
- D.
15%
- E.
8%
Attempted by 11 students.
Show answer & explanation
Correct answer: C
Concept
In a data-interpretation graph, the plotted figure may represent only a fraction of the real quantity. To recover an actual total from a fraction, multiply by the reciprocal of that fraction. To compare two actual quantities, the formula "how much percent X is less than Y" is (Y − X) / Y × 100.
Here each plotted point is one-third of the items actually sold, so an actual yearly total = 3 × (plotted value). A year-on-year growth of 20% over a base year multiplies the base total by 1.20.
Application
Read the required plotted points. D in 2021 = 520; A in 2022 = 700.
Find D's actual total in 2023. The 2023 total is 20% more than the 2021 total, so D(2023) = 3 × 520 × 1.20 = 1560 × 1.20 = 1872.
Find A's actual total in 2022. A(2022) = 3 × 700 = 2100.
Apply the percentage-less formula: (2100 − 1872) / 2100 × 100 = 228 / 2100 × 100 = 10.86%.
Round to the nearest given choice: 10.86% ≈ 11%.
Cross-check
Because every total carries the same factor of 3, the factor cancels in the ratio, so the percentage can be found straight from the plotted values: D(2023)-equivalent = 520 × 1.20 = 624 and A(2022) = 700, giving (700 − 624) / 700 × 100 = 10.86%. Both routes agree, confirming 11%.