Read the following line graph carefully and answer the questions given below.…
2024
Read the following line graph carefully and answer the questions given below. The line graph shows 1/3rd of the total items sold by five different shops in two different years.
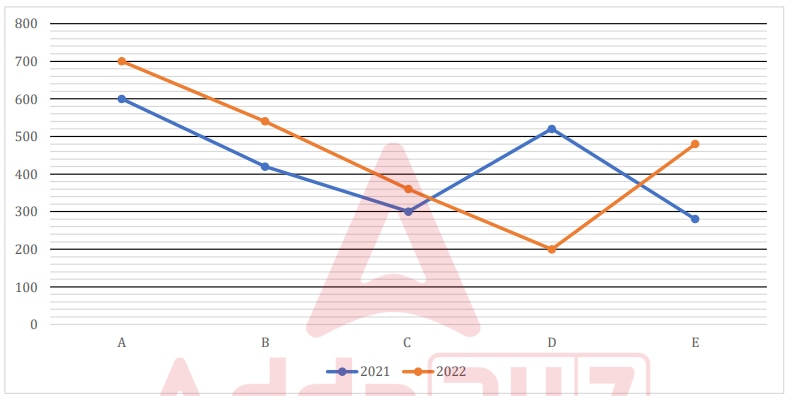
Note:
(i). Total number of items sold by each shops in 2023 is 20% more than that in 2021.
(ii). The total number of items sold by each shops in each year, which is given in the line graph, is one-third of the total items sold.
Find the sum of the total number of items sold by A, B and C in 2023.
Answer: D. 4752 — Concept: When a chart shows only a fixed fraction of a whole, the whole is recovered by dividing by that fraction (here each plotted value is one-third of the…
- A.
4235
- B.
4450
- C.
4980
- D.
4752
- E.
4898
Attempted by 12 students.
Show answer & explanation
Correct answer: D
Concept: When a chart shows only a fixed fraction of a whole, the whole is recovered by dividing by that fraction (here each plotted value is one-third of the actual total, so actual total = 3 x plotted value). A percentage increase of p% scales a quantity by the factor (1 + p/100); a 20% rise multiplies by 1.2.
Application: Read the 2021 (one-third) values from the line graph for shops A, B and C, scale each to the true 2021 total, then apply the 20% rise to get the 2023 total.
From the graph (2021), the plotted one-third values are A = 600, B = 420, C = 300.
Actual 2021 total per shop = 3 x plotted value: A = 1800, B = 1260, C = 900.
2023 total = 1.2 x 2021 total: A = 1.2 x 1800 = 2160, B = 1.2 x 1260 = 1512, C = 1.2 x 900 = 1080.
Sum for A, B and C in 2023 = 2160 + 1512 + 1080 = 4752.
Cross-check: The combined one-third 2021 value is 600 + 420 + 300 = 1320, so the actual 2021 sum is 3 x 1320 = 3960; raising it by 20% gives 3960 x 1.2 = 4752, matching the step-by-step result.