In the graph below, the concentration of a particular pollutant in a lake is…
GATE · 2017 · ME · Set 2 · General AptitudeModified — slightly modified from the official paper; see the solution
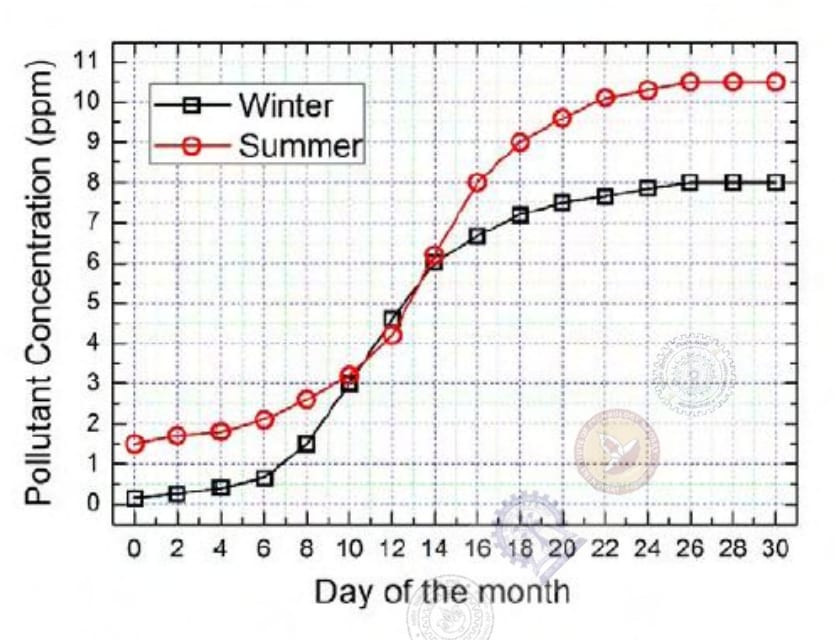
In the graph below, the concentration of a particular pollutant in a lake is plotted over (alternate) days of a month in winter (average temperature 10 °C) and a month in summer (average temperature 30 °C).
Consider the following statements based on the data shown above:
i. Over the given months, the difference between the maximum and the minimum pollutant concentrations is the same in both winter and summer.
ii. There are at least three days in the summer month such that the pollutant concentrations on those days are within 1 ppm of the pollutant concentrations on the corresponding days in the winter month.
Which one of the following options is correct?
- A.
Only i
- B.
Only ii
- C.
Both i and ii
- D.
Neither i nor ii
Sign up free to check your answer
Sign up freeLoading lesson…