In a detailed study of annual crow births in India, it was found that there…
GATE · 2018 · IN · General Aptitude
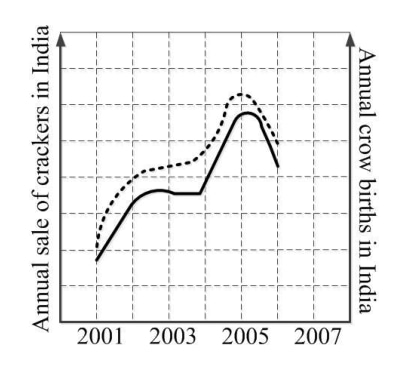
In a detailed study of annual crow births in India, it was found that there was relatively no growth during the period 2002 to 2004 and a sudden spike from 2004 to 2005. In another unrelated study, it was found that the revenue from cracker sales in India which remained fairly flat from 2002 to 2004, saw a sudden spike in 2005 before declining again in 2006. The solid line in the graph below refers to annual sale of crackers and the dashed line refers to the annual crow births in India. Choose the most appropriate inference from the above data.
- A.
There is a strong correlation between crow birth and cracker sales.
- B.
Cracker usage increases crow birth rate.
- C.
If cracker sale declines, crow birth will decline.
- D.
Increased birth rate of crows will cause an increase in the sale of crackers.
Sign up free to check your answer
Sign up freeLoading lesson…