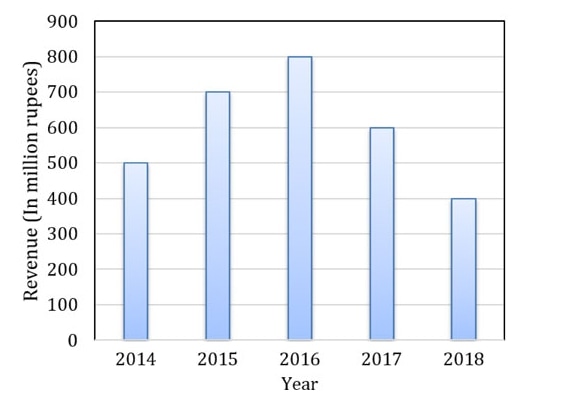
The total revenue of a company during 2014−2018 is shown in the bar graph. If…
GATE · 2020 · CS · General Aptitude
The total revenue of a company during 2014−2018 is shown in the bar graph. If the total expenditure of the company in each year is 500 million rupees, then the aggregate profit or loss (in percentage) on the total expenditure of the company during 2014−2018 is _________ .
- A.
16.67% profit
- B.
16.67% loss
- C.
20% profit
- D.
20% loss
Attempted by 205 students.
Sign up free to check your answer
Sign up freeLoading lesson…