

Python Memory Model and Garbage Collection: References, Cycles, and Profiling
Build a practical model of Python references, then trace aliases, collect a two-object cycle, and measure allocation growth by line.
KnowledgeGate Team
Exam prep & CS education
Updated 15 Nov 20265 min read

Two names can expose the same mutable object. del does not necessarily destroy that object, and a growing process does not prove that garbage collection is broken. References run from roots, CPython needs a cyclic collector in addition to reference counting, and tracemalloc provides a reproducible profiling workflow. Python's official data model defines objects, values, and types; CPython adds implementation-specific memory-management details.
Python stores objects and binds names to them
Every Python object has three properties: identity, type, and value. A name is a binding to an object, not a box containing a copied value. Use is to compare identity and == to compare values. id() returns an integer representing identity. CPython currently uses the object's memory address for that integer, but portable Python code must not depend on this implementation detail.
Mutability describes whether an object's value can change. The list [10, 20] can change in place. By contrast, evaluating 10 + 1 produces the value 11; it does not mutate the integer 10. Containers such as lists and dictionaries hold references to other objects. The list-focused identity and copying drills in Python Output-Based Questions: 13 Solved Snippets establish basic alias tracing. Object reachability, cyclic garbage, and allocation profiling follow those references beyond a single output line.
Reachability is the rule to carry forward. An object reachable from a live name or container must remain alive. An unreachable object may be collected. Python does not promise immediate finalisation, so program logic should never depend on it.
Worked example: aliasing, equality, and mutation
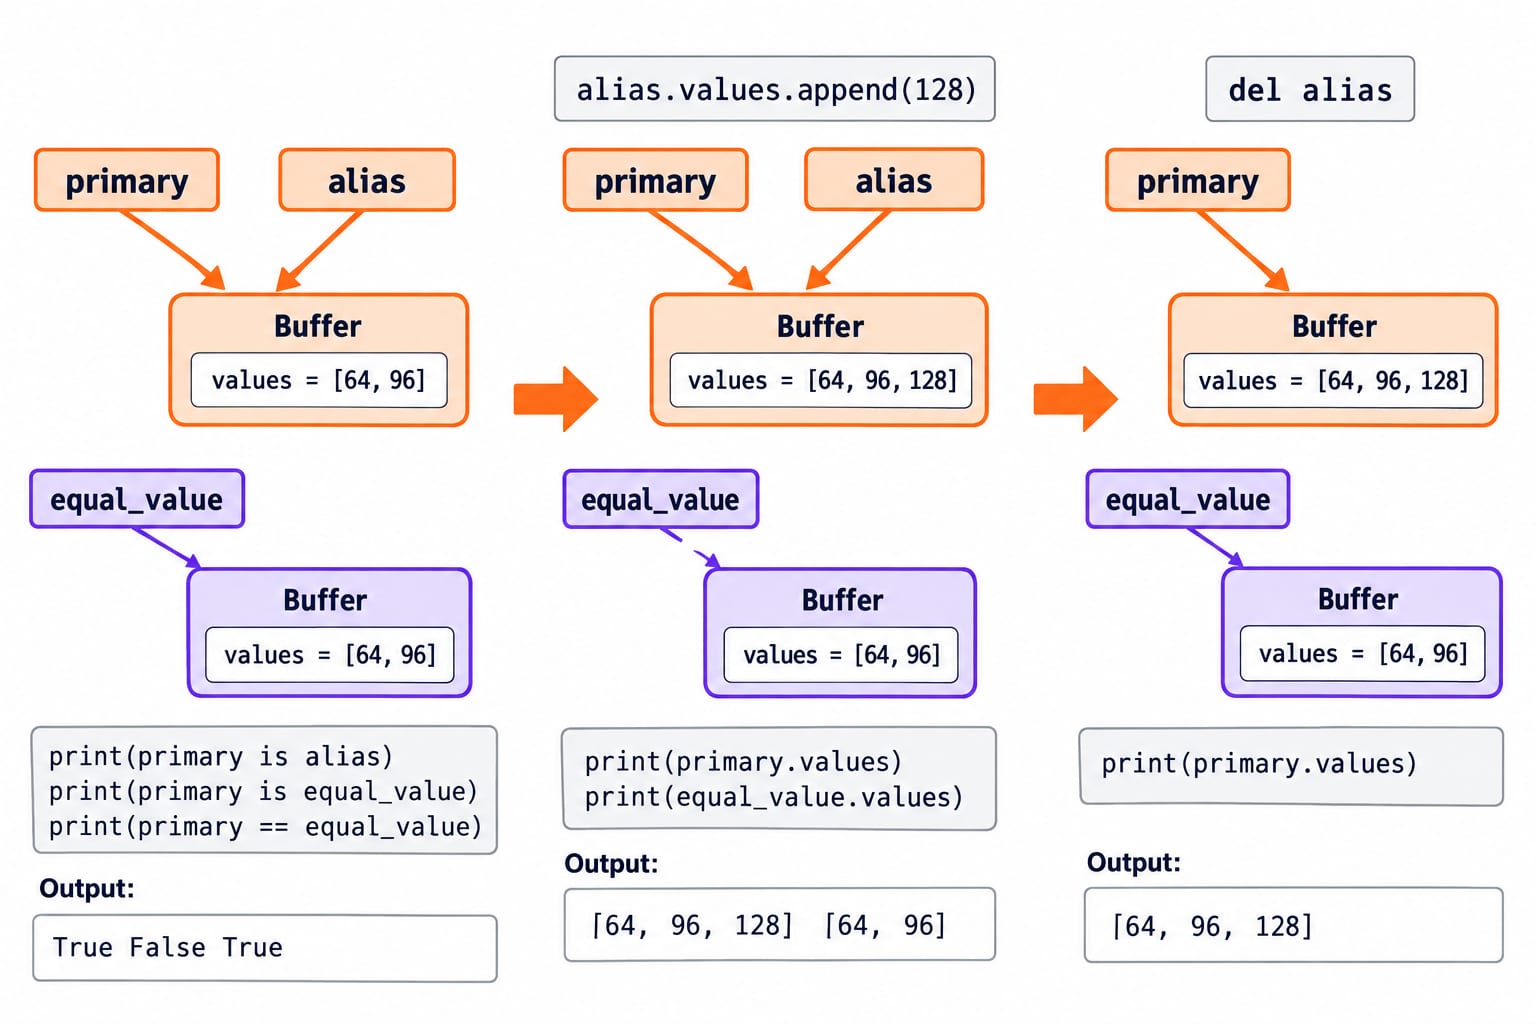
Run this in a fresh process:
class Buffer:
    def __init__(self, values):
        self.values = values

    def __eq__(self, other):
        return isinstance(other, Buffer) and self.values == other.values

primary = Buffer([64, 96])
alias = primary
equal_value = Buffer([64, 96])

print(primary is alias, primary is equal_value, primary == equal_value)
alias.values.append(128)
print(primary.values, equal_value.values)
del alias
print(primary.values)
The exact output is:
True False True
[64, 96, 128] [64, 96]
[64, 96, 128]
primary and alias reach one Buffer, while equal_value reaches a distinct object with an equal value. Appending through alias mutates only the first Buffer's list. del alias removes one root, but primary still keeps that Buffer reachable.
What reference counting does in CPython
The official data-model documentation says CPython currently uses reference counting, with delayed detection of cyclic garbage. The useful intuition is that removing the final ordinary reference often makes a non-cyclic object reclaimable immediately in CPython. Python code must not depend on this timing because other implementations can behave differently.
For the previous example, count only visible bindings as a conceptual ledger. The first Buffer has primary and alias, then only primary after del alias. The equal_value name reaches the second Buffer. This is not the runtime's exact internal count. Avoid building arguments around sys.getrefcount(): the call adds a temporary reference, and some CPython objects can be immortal.
Garbage collection is also not a resource-lifetime API. Use with for files, locks, and managed network resources, or call close() explicitly when required.
Why cycles need a garbage collector
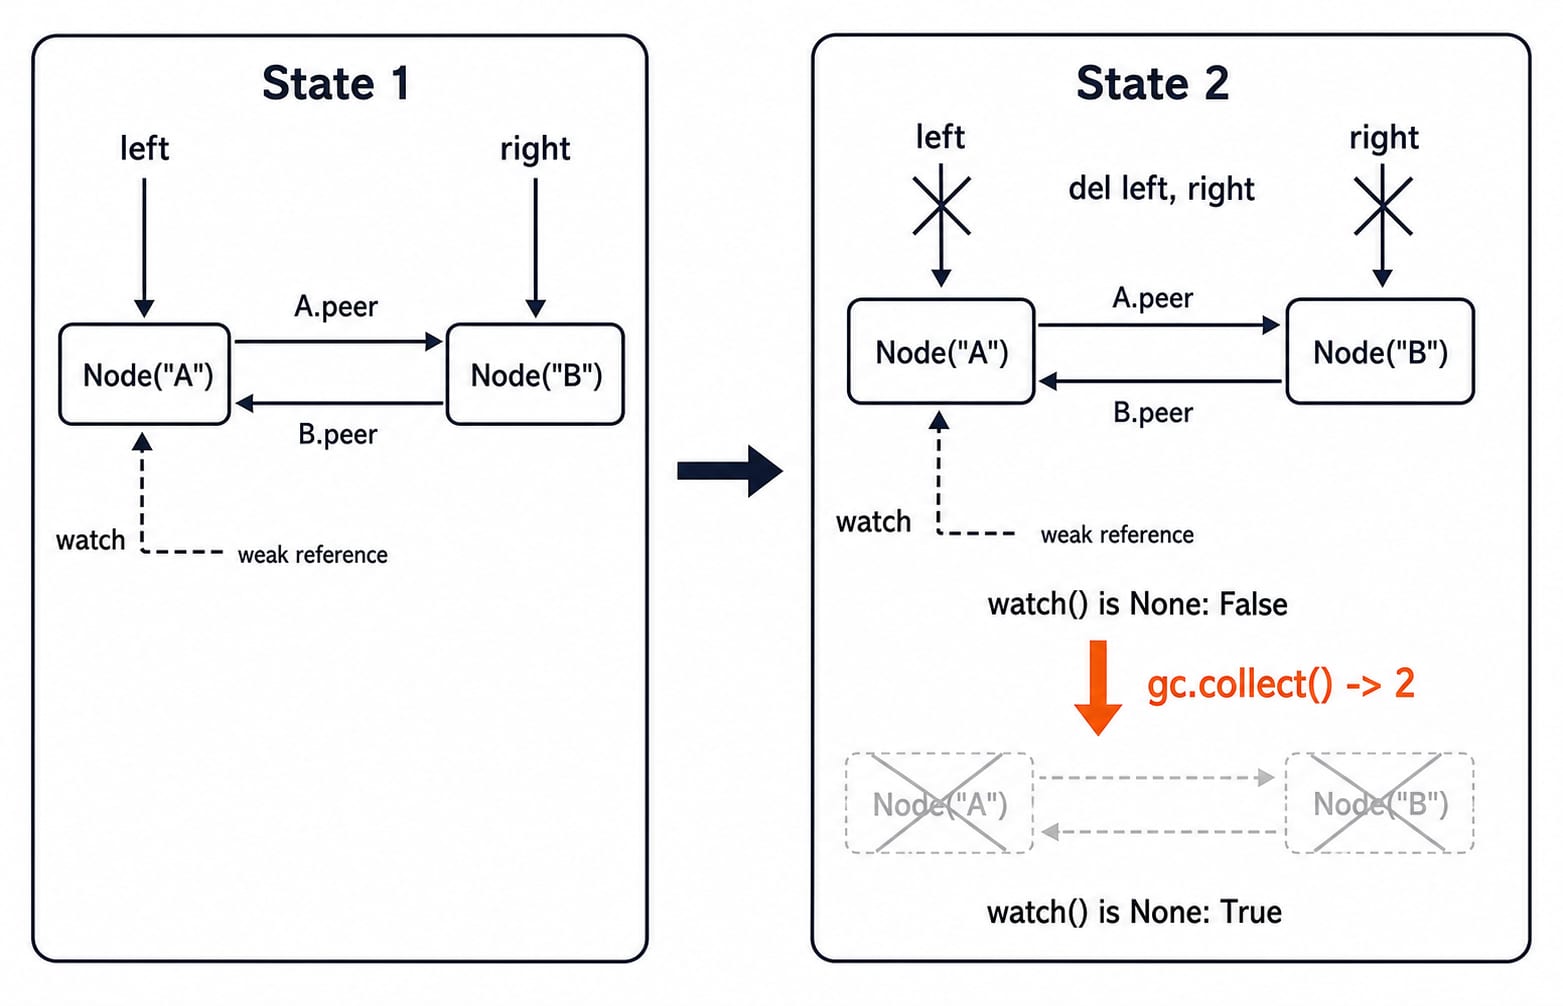
A cycle defeats reference counting alone. Suppose objects A and B point to each other. After all external roots disappear, A still has a reference from B and B still has one from A. Neither count reaches zero, although the pair is unreachable from the program. The gc module, documented on docs.python.org, provides a collector that supplements reference counting by finding such unreachable cycles.
This controlled CPython demonstration makes the transition observable:
import gc
import weakref

class Node:
    def __init__(self, label):
        self.label = label
        self.peer = None

gc.collect()
was_enabled = gc.isenabled()
gc.disable()

left = Node("A")
right = Node("B")
left.peer = right
right.peer = left
watch = weakref.ref(left)

del left, right
print(watch() is None)
print(gc.collect())
print(watch() is None)

if was_enabled:
    gc.enable()
In the controlled run, the output is False, 2, then True. The first unprinted gc.collect() clears earlier garbage. Disabling automatic collection preserves the before state. The observed 2 is a CPython result for these two tracked Node instances, not a guarantee across implementations. The portable conclusion is that watch() changes from a live object to None after collection. Production code normally leaves automatic collection enabled. Manual collection is mainly useful for diagnostics or controlled lifecycles.
Practise reading reference graphs with Binary Trees and Binary Search Trees, where each node's children are exactly such references.
Profile allocation growth with tracemalloc
Use snapshots when the real question is, "Which line added Python allocations?"
import tracemalloc

tracemalloc.start()
before = tracemalloc.take_snapshot()
payload = [bytearray(1024) for _ in range(1000)]
after = tracemalloc.take_snapshot()

print(len(payload), sum(map(len, payload)))
growth = after.compare_to(before, "lineno")
for stat in growth[:3]:
    print(stat)

del payload
released = tracemalloc.take_snapshot()
for stat in released.compare_to(after, "lineno")[:3]:
    print(stat)
The first line is exactly 1000 1024000: 1,000 bytearrays times 1,024 payload bytes equals 1,024,000 bytes before list and Python-object overhead. The other lines are measurements, not golden output. Following the tracemalloc snapshot workflow from the official docs.python.org reference, inspect the first positive StatisticDiff entries at the allocation line. Check size_diff, count_diff, and the traceback.
After del payload, compare the third snapshot with after. A negative change at the allocation site is evidence that those traced Python allocations were released. It does not promise that process resident memory will fall by the same amount. tracemalloc traces memory blocks allocated by Python, while allocator behaviour and object overhead vary by build.
Common GC and memory-debugging traps
First, do not use is for value comparison or assume assignment copies an object. Before mutation in the worked output, primary is equal_value is false but primary == equal_value is true. Use is for identity checks such as x is None, == for values, and an explicit copy when mutation must be independent.
Second, del x removes a binding; it does not command the runtime to destroy an object. An unreachable cycle is collectible. An accidentally reachable cache, global list, callback, or closure is retained, and forcing gc.collect() cannot rescue it.
Third, one refcount or one memory number is not proof of a leak. Reproduce the growth, compare tracemalloc snapshots by line, and inspect referrers only when needed. Then confirm that the suspected owner releases the object. Debuggers, tracebacks, and inspection tools can themselves retain references, so close the diagnostic loop with a clean rerun.
The short version: tests, interviews, and next steps
Typical questions ask you to predict the aliasing output, decide whether a graph stays reachable after del, or choose gc for cycle inspection versus tracemalloc for allocation-site growth. For Python guarantees, follow the official documentation. Label answers about immediate reference-count reclamation or the observed collection count as CPython-specific.
Keep this mental model:
Names reference objects.
Containers reference other objects.
CPython reference counting handles most non-cyclic reclamation.
The cyclic collector finds unreachable cycles, while
tracemalloclocates Python allocation growth.
For guided practice, start with the Python Course: Concepts, MCQs & Coding. Use DSA Using Python to apply reference graphs to linked structures and algorithms. The Coding & Skill Development Courses page is the broader catalogue option. GC tuning does not fix every form of memory growth, so reproduce and measure before changing collector settings.
Keep learning
Python Dictionaries Explained: Keys, Methods, Worked Examples and Exam Traps
Learn how Python dictionaries store, retrieve and mutate values. Trace a complete frequency counter, then practise the membership, aliasing and duplicate-key traps that make output questions tricky.
Updated 18 Nov 20265 min readPython

Python Conditional Statements Explained: if, elif, else, Nested Logic and Worked Examples
Learn a reliable way to trace Python branches, from Boolean expressions and short-circuiting to nested decisions, truthiness, boundary checks, and a complete scholarship classifier.
Updated 17 Nov 20266 min readPython
Python Scope and Flow Explained: Worked Examples and Exam Question Patterns
Learn to separate Python name resolution from execution order with a nested-function trace, an UnboundLocalError repair, module examples, and exam-style checks.
Updated 16 Nov 20266 min readPython

Asyncio in Python: Event Loops, Coroutines and Runnable Examples
Build a clear mental model of Python's event loop, then run two dependency-free examples covering concurrent waits, result ordering, timeouts and cleanup.
Updated 15 Nov 20266 min readPython