BTSC Lab Assistant Computer Basics: Files, Spreadsheets and Lab Data
Follow a four-sample pH dataset from a preserved CSV to a clean XLSX workbook, checked averages, validation rules, an exception chart and a fixed PDF report.
KnowledgeGate Team
Exam prep & CS education
Updated 2 Aug 20266 min read
Words such as file, cell and chart can look familiar until they appear together in a small lab-record task. Then a wrong folder, a text value or a copied formula quietly damages the result. Take four pH readings from an instrument export, average them in a workbook, let a validation rule and a filter catch the two that fall outside the acceptable band, chart those exceptions, and issue a fixed report. The readings are practice data invented for the example, so every threshold here is a teaching figure and not a laboratory limit.
1. Organise a lab record as files, folders and paths
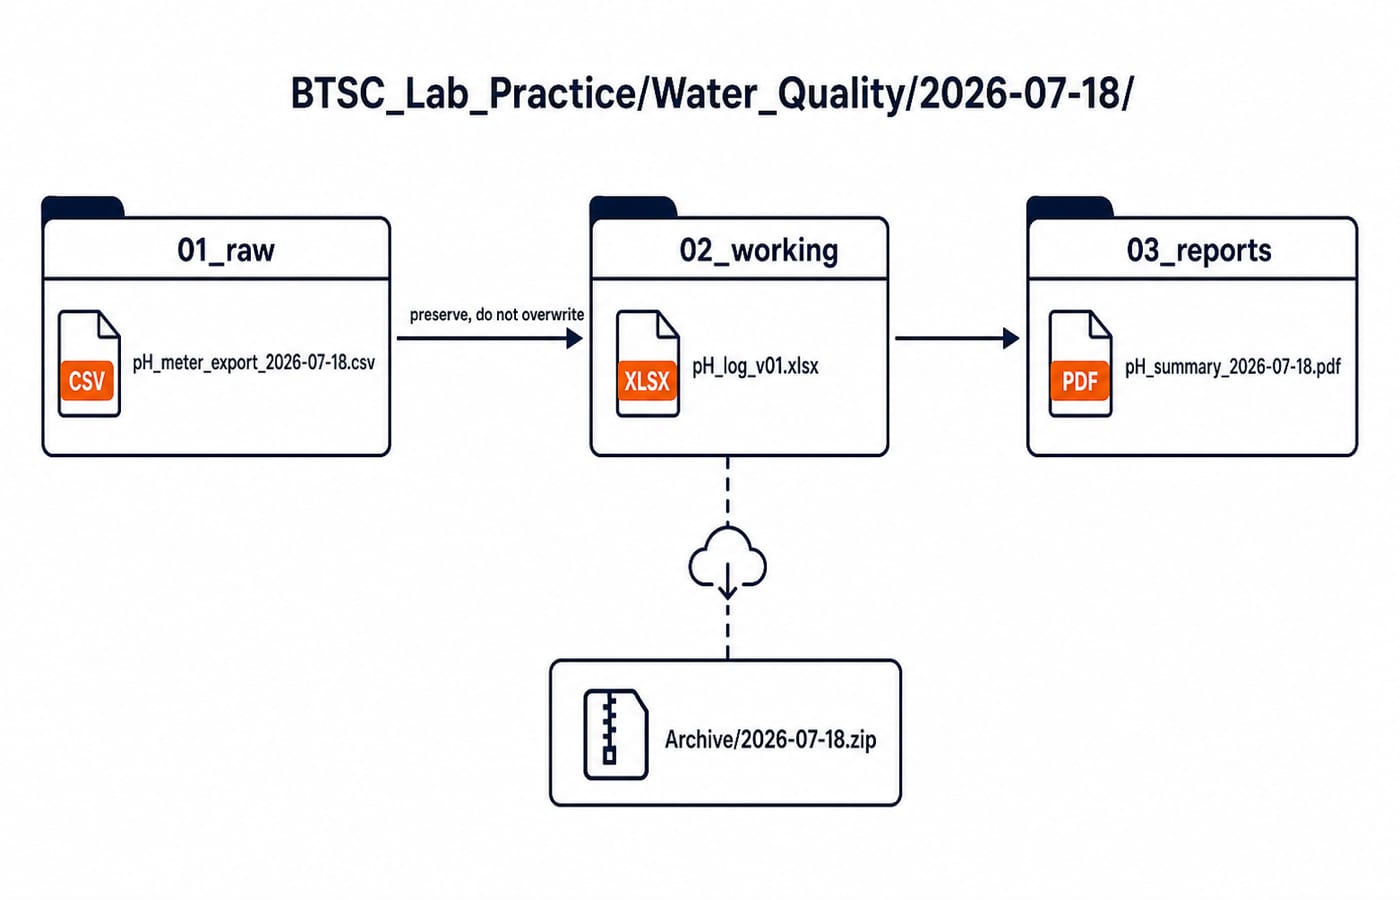
A file stores content, a folder groups related files, an extension signals the file format, and a path identifies where an item is stored. Consider BTSC_Lab_Practice/Water_Quality/2026-07-18/01_raw/pH_meter_export_2026-07-18.csv. The first two folders identify the practice area and dataset. The date folder uses YYYY-MM-DD, so daily folders sort in chronological order. 01_raw identifies the processing stage, while .csv signals plain tabular data. This is clearer and safer than names such as final data new.
Use this three-stage tree:
01_raw/pH_meter_export_2026-07-18.csv: preserve the instrument export.02_working/pH_log_v01.xlsx: perform calculations in the workbook.03_reports/pH_summary_2026-07-18.pdf: create a fixed viewing copy.
File and folder handling assumes the hardware and software layer beneath it. If those basics are still shaky, Computer Fundamentals for CS Teaching Exams covers them first.
2. Build one clean spreadsheet table from the observations
A workbook is the XLSX file, and a worksheet is one sheet inside it. Name the sheet pH_Log. A row runs horizontally, a column vertically, a cell is their intersection, and a range is a group such as D2:F5. In this table, one row represents one sample and one column represents one variable.
Put the headers in row 1 and enter these four sample rows before adding any formula:
Row | A Sample ID | B Date | C Analyst | D Replicate 1 | E Replicate 2 | F Replicate 3 | G Average pH | H Status |
|---|---|---|---|---|---|---|---|---|
2 | S-101 | 2026-07-18 | Asha | 6.8 | 6.9 | 6.7 | ||
3 | S-102 | 2026-07-18 | Imran | 7.4 | 7.6 | 7.5 | ||
4 | S-103 | 2026-07-18 | Asha | 8.1 | 8.0 | 8.2 | ||
5 | S-104 | 2026-07-18 | Neha | 6.3 | 6.4 | 6.5 |
Store dates as true date values and readings as numbers. Put the unit in the heading or metadata, not inside entries such as 6.8 pH, which spreadsheets may treat as text.
3. Calculate averages and status with cell references
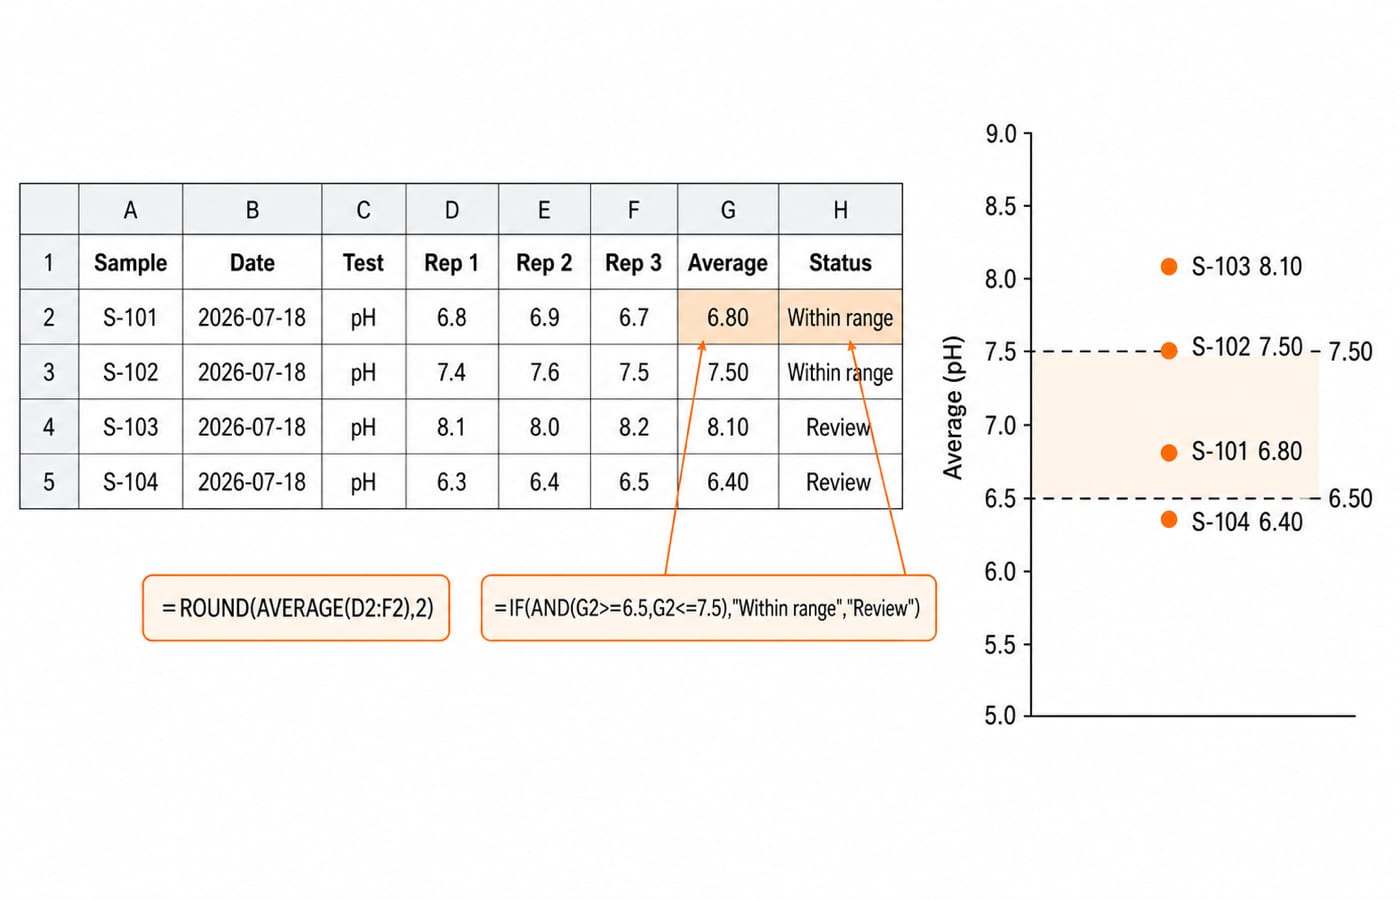
In G2, enter =ROUND(AVERAGE(D2:F2),2). The calculation is:
(6.8 + 6.9 + 6.7) / 3 = 20.4 / 3 = 6.80
Format G2:G5 to display two decimal places, then copy G2 down. Relative references move with the formula, so D2:F2 becomes D3:F3 in row 3. The four results are 6.80, 7.50, 8.10 and 6.40.
Set an acceptable band of 6.50 to 7.50 for this sheet; a real laboratory takes that band from the standard its tests are run against. Enter =IF(AND(G2>=6.5,G2<=7.5),"Within range","Review") in H2 and copy it down. The outputs are Within range, Within range, Review and Review.
Here, AVERAGE(D2:F2) and (D2+E2+F2)/3 both return 6.80. If a replicate is accidentally blank, however, AVERAGE ignores the blank while division by three can lower the result by treating the missing addition as zero. Neither behaviour should hide missing data. Investigate or flag the absent reading before accepting the record.
4. Prevent bad entries, filter exceptions and chart the result
Turn A1:H5 into a table with headers. Then add three checks:
Restrict
C2:C100to the listAsha,Imran,Neha. This catchesAshaa.Allow only decimals from
0through14inD2:F100. This rejects14.8.Apply conditional formatting to
A2:A100with=COUNTIF($A$2:$A$100,A2)>1. A secondS-103is then flagged as a duplicate.
These rules prevent inconsistent names, out-of-band entries and repeated IDs before they contaminate later work. Next, filter H to Review. The visible exceptions should be S-103, 8.10 and S-104, 6.40.
Build a helper range J1:M5 with the headers Sample, Average, Lower and Upper. Put S-101 to S-104 in J2:J5, the averages 6.80, 7.50, 8.10 and 6.40 in K2:K5, 6.50 in every cell of L2:L5, and 7.50 in every cell of M2:M5. Create a line or combo chart with samples on the horizontal axis and pH on the vertical axis. Use average as the main series and both limits as dashed reference lines.
5. Preserve meaning when you save, share or export
The same data behaves differently across formats. CSV holds plain tabular values but does not preserve working formulas, validation, multiple sheets or charts. XLSX preserves those spreadsheet features. PDF gives a fixed report for viewing, but it cannot recalculate the workbook.
If pH_log_v01.xlsx is exported to CSV, displayed values may remain, but the formulas and controls behind them do not travel as working features. Keep the raw export read-only, edit the XLSX copy, and save pH_log_v02.xlsx after a reviewed correction with a note explaining why. Simply renaming .csv to .xlsx changes the filename, not the format.
6. Correct the mistakes that make a neat sheet unreliable
Why: someone types
6.8 pHinto a reading cell. Problem: the value becomes text and breaks numeric calculations. Instead: store6.8and put the unit in the header.Why: entries mix
6,8and6.8. Problem: the comma version may be parsed as text under the chosen locale. Instead: agree on one numeric convention.Why: cells are merged to make the sheet look tidy. Problem: sorting and filtering a rectangular dataset becomes unreliable. Instead: keep one record per row without merged data cells.
Why: S-103 is coloured manually. Problem: the colour does not explain or reproduce the decision. Instead: calculate
Statusand base conditional formatting on that value.
A formula trap is just as serious. If every row contains a fixed reference to D2:F2, every average repeats 6.80. A relative copy should produce 7.50, 8.10 and 6.40 in the next rows. The overall average is (6.80 + 7.50 + 8.10 + 6.40) / 4 = 28.80 / 4 = 7.20, but that summary does not erase the two flagged samples.
7. Practise the ways an objective question can test the same skill
Objective papers reach this material through five recurring shapes. Identify which of two filenames sorts cleanly. Choose the formula that averages D2:F2. Predict the status when G4 reads 8.10. Explain why a CSV cannot carry a working chart. Name the samples that fall outside 6.50 to 7.50. Answer each one with a one-line reason rather than an option letter, because the reason is what survives a slightly altered stem.
The Excel Functions & Charts subtopic on KnowledgeGate holds over 100 practice questions in these shapes. The SSC CGL Tier 2 Computer Knowledge article sets out a second computer-awareness question map to work through. The same file, formula and export questions recur across other state and central technical recruitments in the Govt Jobs preparation category, so this practice carries if you widen your applications. The section list and mark split for the current BTSC cycle are on the official BTSC site.
8. Short version and next step
Name files clearly, preserve the raw export, keep one observation per row and one variable per column, let formulas and validation carry the judgement, then read the exceptions off a filtered table and a chart. Rebuild the four-row sheet from a blank workbook without copying it, and check every average and status against the worked values above. For the rest of the syllabus the BTSC Lab Assistant complete course carries the full plan, and the BTSC Lab Assistant test series is the faster way to find which topics still fail under time.
Keep learning
BTSC Lab Assistant Physics Lab: Instruments, Readings and Error Calculations
Learn a fixed method for selecting lab instruments, reading their scales, correcting zero error and reporting calculated results with sensible uncertainty.
Updated 16 Aug 20266 min readBTSC Lab Assistant

BTSC Lab Assistant Biology Lab: Microscopy and Specimen Handling Guide
Build an exam-ready microscopy workflow through a labelled onion wet mount, a checked cell-size estimate, safe specimen handling, and six common errors.
Updated 14 Aug 20265 min readBTSC Lab Assistant
BTSC Lab Assistant Job Profile: Records, Equipment Care and Daily Lab Workflow
Build a realistic CS/IT Laboratory Assistant role model around readiness checks, auditable registers, safe fault handling and evidence-based handover.
Updated 12 Aug 20265 min readBTSC Lab Assistant
BTSC Lab Assistant PYQ Analysis: Sort Common and Trade Topics
Turn a mixed PYQ score into a useful repair plan. This method separates common and trade topics, codes each miss and assigns revision time from your own errors.
Updated 10 Aug 20266 min readBTSC Lab Assistant