Study the data in the table and answer the questions that follow. Consider the…
2020
Study the data in the table and answer the questions that follow.
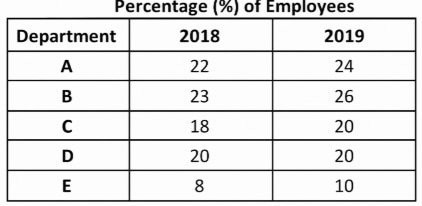
Consider the following table that shows the percentage (%) distribution of employees in five different departments A-E in a company during the years 2018 and 2019. There is a total number of 18000 and 20000 employees in the company during the years 2018 and 2019 respectively.
Department-wise Distribution of Employees
Ques: If 300 employees had left the department - B at the end of 2018, then how many new employees joined in 2019 in the department - B?
Answer: C. 1360 — Department B in 2018 = 23% of 18000 = 4140 employees. Department B in 2019 = 26% of 20000 = 5200 employees. Of the 4140 employees at the end of 2018, 300…
- A.
480
- B.
960
- C.
1360
- D.
1140
Attempted by 2 students.
Show answer & explanation
Correct answer: C
Department B in 2018 = 23% of 18000 = 4140 employees.
Department B in 2019 = 26% of 20000 = 5200 employees.
Of the 4140 employees at the end of 2018, 300 left, so 4140 − 300 = 3840 employees continued into 2019.
New employees who joined Department B in 2019 = 5200 − 3840 = 1360.