Study the data in the table below and answer the question that follows.…
2020
Study the data in the table below and answer the question that follows.
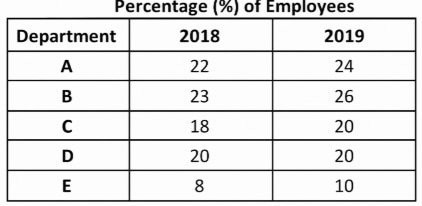
Consider the following table showing the percentage (%) distribution of employees across five departments A-E in a company during 2018 and 2019. The total number of employees in the company was 18000 in 2018 and 20000 in 2019.
Department-wise Distribution of Employees
With respect to the year 2018, what is the approximate percentage increase in the number of employees in Department-C in the year 2019?
Answer: C. 23.45 % — Number of employees in Department-C in 2018 = 18% of 18000 = 3240. Number of employees in Department-C in 2019 = 20% of 20000 = 4000. Increase in number of…
- A.
2 %
- B.
2.34 %
- C.
23.45 %
- D.
8.34 %
Attempted by 2 students.
Show answer & explanation
Correct answer: C
Number of employees in Department-C in 2018 = 18% of 18000 = 3240.
Number of employees in Department-C in 2019 = 20% of 20000 = 4000.
Increase in number of employees = 4000 - 3240 = 760.
Percentage increase = (760 / 3240) × 100 = 23.456... ≈ 23.45%.