Study the data in the table and answer the questions that follow. Consider the…
2020
Study the data in the table and answer the questions that follow.
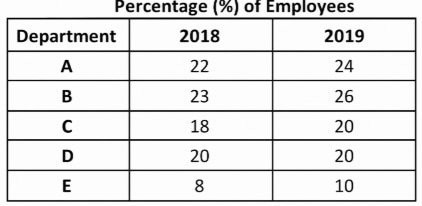
Consider the following table that shows the percentage (%) distribution of employees in five different departments A-E in a company during the years 2018 and 2019. There is a total number of 18000 and 20000 employees in the company during the years 2018 and 2019 respectively.
Department-wise Distribution of Employees
Ques: In which department the variation (represented by absolute numbers) in employee strength is maximum in 2019 with reference to 2018?
Answer: B. Department - B — Total employees: 18000 in 2018 and 20000 in 2019. For each department, convert its percentage share into an actual number of employees in each year, then take…
- A.
Department - A
- B.
Department - B
- C.
Department - D
- D.
Department - E
Attempted by 2 students.
Show answer & explanation
Correct answer: B
Total employees: 18000 in 2018 and 20000 in 2019. For each department, convert its percentage share into an actual number of employees in each year, then take the absolute difference.
Department A: 22% of 18000 = 3960 and 24% of 20000 = 4800 → change = 840.
Department B: 23% of 18000 = 4140 and 26% of 20000 = 5200 → change = 1060.
Department C: 18% of 18000 = 3240 and 20% of 20000 = 4000 → change = 760.
Department D: 20% of 18000 = 3600 and 20% of 20000 = 4000 → change = 400.
Department E: 8% of 18000 = 1440 and 10% of 20000 = 2000 → change = 560.
The largest absolute change is 1060 employees, which occurs in Department B. Hence the variation in employee strength is maximum in Department B.