Based on the data in the table, answer the questions that follow. Consider the…
2020
Based on the data in the table, answer the questions that follow.
Consider the following table which contains year-wise data of installed Renewable Energy capacity for four countries (X, Y, Z, T) over a period of 5 years from 2015 to 2019.
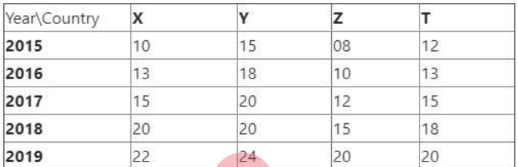
Ques: In any given year, compared to the previous year which country(s) registered maximum growth (%)?
Answer: D. X and Z — Compute the year-to-year percentage growth for each country. For X, the maximum is from 2017 to 2018: (20-15)/15 x 100 = 33.33%. For Z, the maximum is from…
- A.
T
- B.
Z and Y
- C.
Y
- D.
X and Z
Attempted by 3 students.
Show answer & explanation
Correct answer: D
Compute the year-to-year percentage growth for each country. For X, the maximum is from 2017 to 2018: (20-15)/15 x 100 = 33.33%. For Z, the maximum is from 2018 to 2019: (20-15)/15 x 100 = 33.33%. Y reaches only 20% at most and T also reaches only 20% at most. Therefore, the countries registering the maximum growth are X and Z, so option D is correct.