Directions: The line graph shows the percentage of people using debit card to…
2023
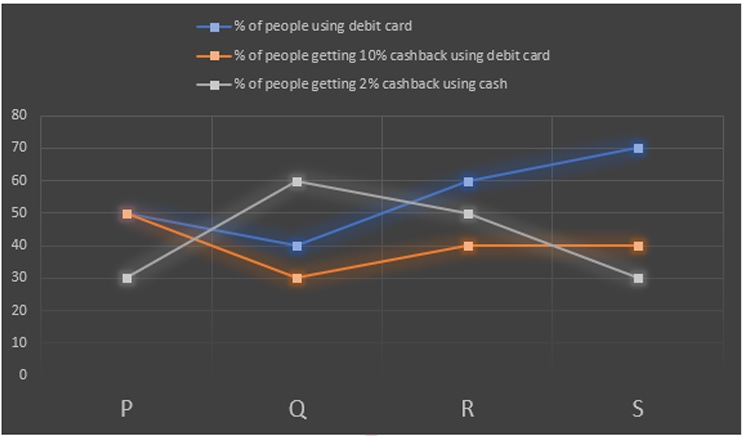
Directions: The line graph shows the percentage of people using debit card to pay the bill, percentage of people getting 10% cashback using debit card out of the total people using debit card for payment, percentage of people getting 2% cashback using cash payments out of the total people using cash for payment while paying their bills either through debit card or cash only in four different restaurants (P, Q, R and S) on any day. Read the line graph carefully and answer the following questions.
Note: (i) Cash back is given to customers in the given manner.
1. Debit card users get 10% cashback
2. Cash payments users get 2 % cashback
(ii) Total people who paid bill using debit card = number of people getting 10% discount + number of people did not get any discount using debit card
(iii) Total people who paid bill using cash = number of people getting 2% discount + number of people did not get any discount using cash
In restaurant P, 400 customers are using debit card but not getting cashback, then find the number of people getting cashback in restaurant P?
Answer: A. 640 — Concept: In a percentage-based data-interpretation chart, every plotted percentage is a share of a stated base, so each rate must be applied to the correct…
- A.
640
- B.
650
- C.
660
- D.
670
- E.
None of these
Attempted by 11 students.
Show answer & explanation
Correct answer: A
Concept: In a percentage-based data-interpretation chart, every plotted percentage is a share of a stated base, so each rate must be applied to the correct base before counts can be added. Here the debit-card share is a fraction of the restaurant total customers, while each cashback rate is a fraction of that payment mode own users, not of the grand total. Convert the one known absolute count into the total first, then derive every other count from it.
Application (restaurant P): Read the three values plotted above P, then work through the chain of counts.
From the graph at P: share using a debit card = 50%, share of debit users receiving 10% cashback = 50%, and share of cash users receiving 2% cashback = 30%.
Let the total customers at P be T. Debit-card users = 50% of T = T/2; cash users = the remaining T/2.
Debit users who get cashback = 50% of debit users = (1/2)(T/2) = T/4. So debit users with no cashback = T/2 minus T/4 = T/4.
This no-cashback debit count is the given absolute figure: T/4 = 400, hence T = 1600.
Debit-card cashback receivers = T/4 = 400. Cash cashback receivers = 30% of cash users = 30% of (T/2) = 0.30 x 800 = 240.
Total people getting cashback at P = 400 + 240 = 640.
Cross-check: With T = 1600: debit users = 800 (400 with cashback + 400 without) and cash users = 800 (240 with cashback + 560 without). The 400 no-cashback debit figure matches the data, confirming the total and the cashback count of 640.