The line graph given below shows the total number of TVs sold and the…
2025
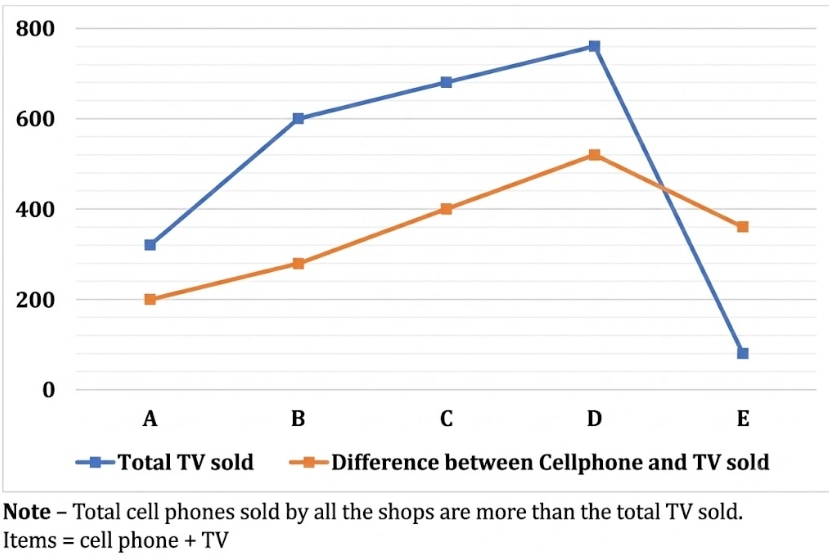
The line graph given below shows the total number of TVs sold and the difference between cell phones and TVs sold by five different shops (A, B, C, D and E). (Cell phones sold by every shop are more than TVs sold, and Items = cell phone + TV.)
Total items sold by E is what percentage more/less than the total TVs sold by D?
Answer: A. 31.57% — ConceptIn this graph each shop has TVs sold (blue line) and the gap 'cell phones minus TVs' (orange line). Because cell phones exceed TVs, Cell phones = TVs +…
- A.
31.57%
- B.
30%
- C.
36%
- D.
31%
- E.
31.25%
Attempted by 12 students.
Show answer & explanation
Correct answer: A
Concept
In this graph each shop has TVs sold (blue line) and the gap 'cell phones minus TVs' (orange line). Because cell phones exceed TVs, Cell phones = TVs + Difference, so the Total items of a shop = TV + Cell phone = (2 x TV) + Difference. To express one quantity as a percentage more or less than a base, use: Percentage change = ((Value - Base) / Base) x 100, where the BASE is the quantity that comes after the words 'more/less than'.
Application
Read shop E from the graph: TVs sold by E = 80 and the difference for E = 360.
Total items of E = (2 x 80) + 360 = 160 + 360 = 520.
Read the base, total TVs sold by D, directly from the blue line: TV sold by D = 760.
Compare E's total with D's TVs: change = 520 - 760 = -240, so E's total is LESS than D's TVs.
Percentage = (240 / 760) x 100 = 31.578...%, which the option set reports as 31.57%.
Cross-check
Verify with the exact fraction: 240/760 = 6/19 = 0.31578..., so the shortfall is 6/19 of 760 = 240, recovering E total = 760 - 240 = 520, which is exactly E's total items. Hence E is 6/19 = about 31.57% less than D's TVs (the figure 31.578...% is reported as 31.57% among the options).